Using the Report Builder (Open Source)
DefectDojo’s report builder lets you assemble a custom report from a set of content widgets, run it, and export the result (for example, by printing it to PDF). Custom reports can summarize the Findings or Endpoints you want to share with an external audience, and can include branding and boilerplate text.
Note: In open-source DefectDojo, you build a report, run it, and retrieve its output as a one-time effort. Report layouts (templates) and the generated report output are not saved in open source. To reuse a layout, you rebuild it in the report builder. To save reusable Themes, Blocks, and Templates, and to keep a persistent history of generated reports, see DefectDojo Pro’s Report Builder.
Opening the Report Builder
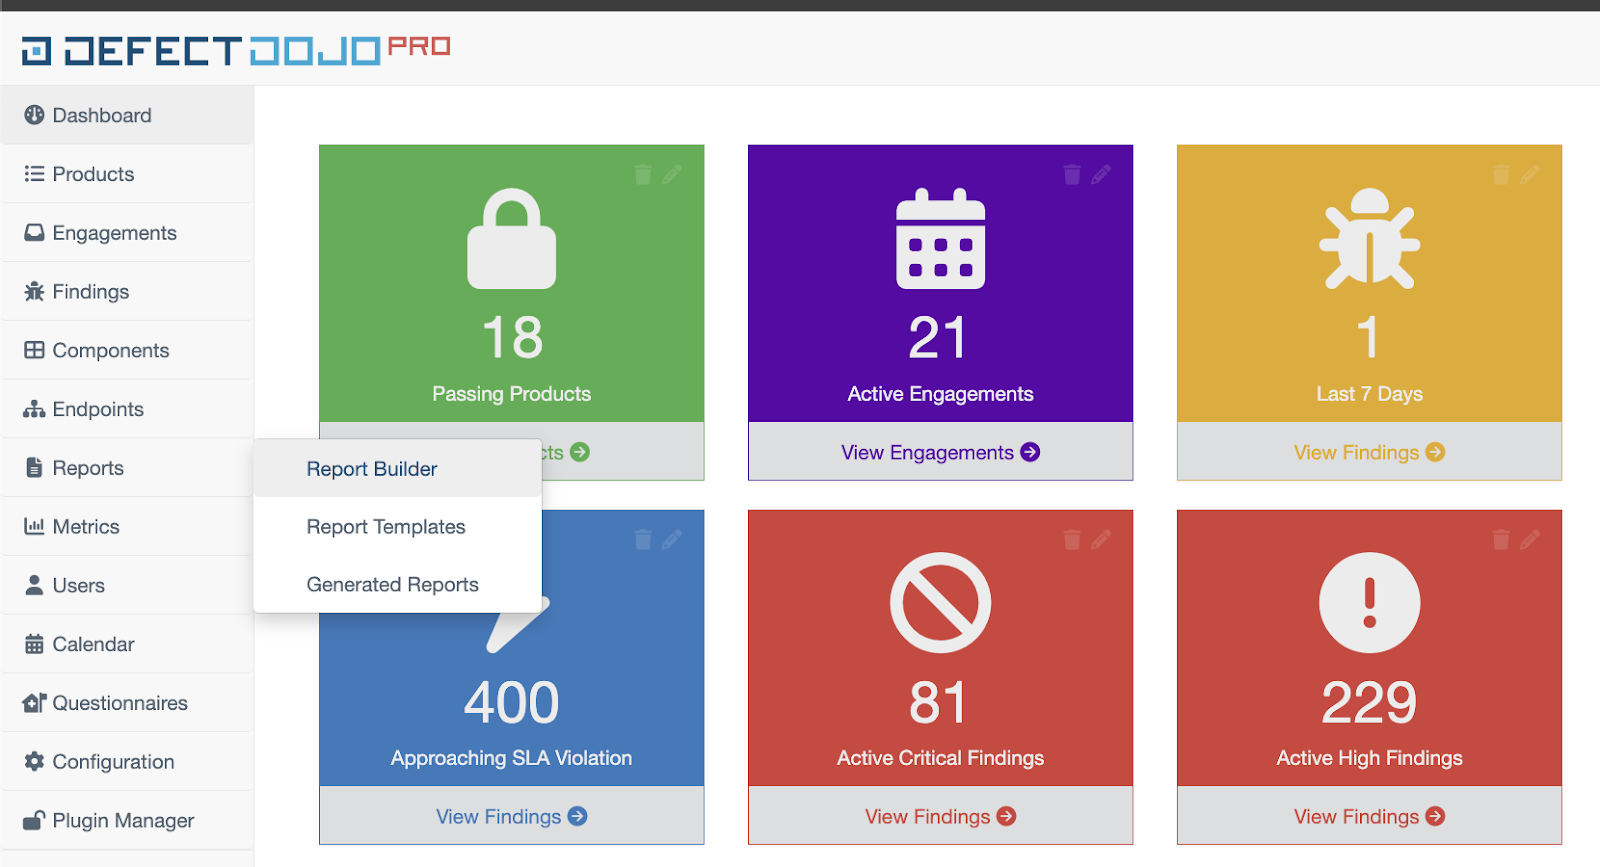
The Report Builder can be opened from the 📄 Reports page on the sidebar.
The report builder page is organized in two columns. The left Report Format column is where you design your report, using widgets from the right Available Widgets column.
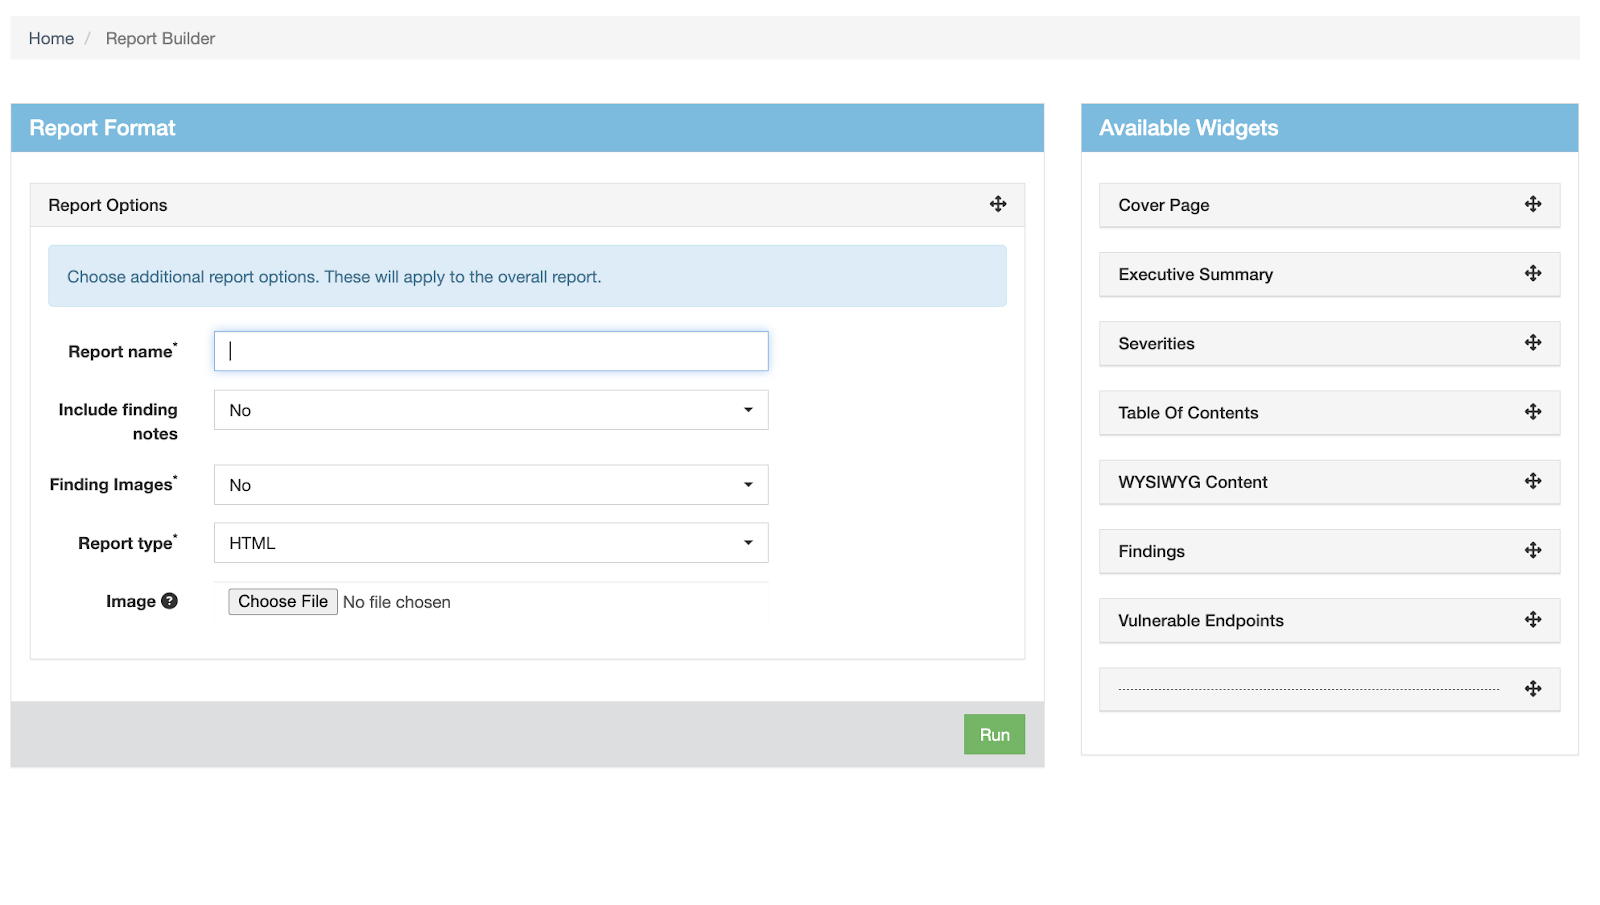
Step 1: Set report options
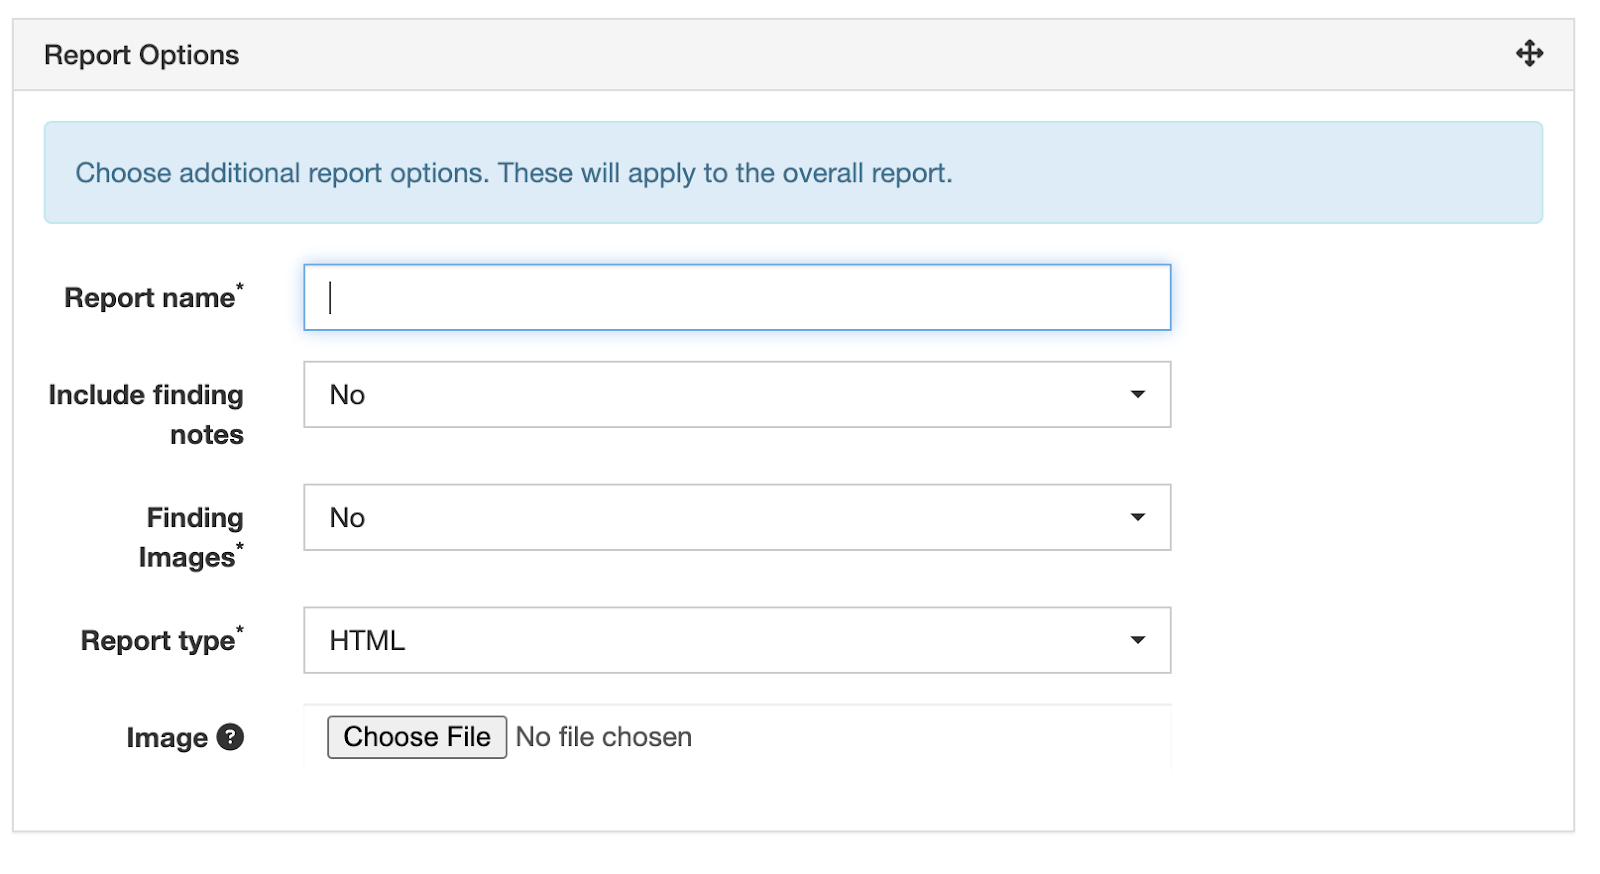
From the Report Options section, you can take the following actions:
- Set a Report Name for the report
- Include user-created Finding Notes in the report
- Include Finding Images in the report
- Upload a header Image to the report
Select a header image for your report
To add an image to the top of your report, click the Choose File button and upload an image to DefectDojo.
The image will automatically resize to fit the document, and will render directly above your Report Name.

Step 2: Add content with widgets
Once you have set your report options, you can begin to design your report using DefectDojo’s widgets.
Widgets are content elements of a report that you add by dragging and dropping them into the Report Format column. The final report will be generated based on the position of each widget, with the Report Name and Header Image rendered at the top.
- The elements of your report can be reordered by dragging and dropping your widgets into a new order.
- To remove a widget from a report, click and drag it back to the right column.
- Widgets can also be collapsed by clicking on the grey header, for ease in navigating through the report builder.
- The Findings widget, WYSIWYG widget, and the Endpoints widget can each be used more than once.
For more information about report widgets, see the Report widget index.
Step 3: Run and view the report
Once you have finished building your report, you can generate it by clicking the green Run button at the bottom of the Report Format section.
DefectDojo generates the report from the widgets you assembled. When generation is complete, you can view the resulting HTML report in your browser.
A generated report is a point-in-time snapshot: it reflects the data in DefectDojo at the moment you ran it and does not update automatically as your data changes.
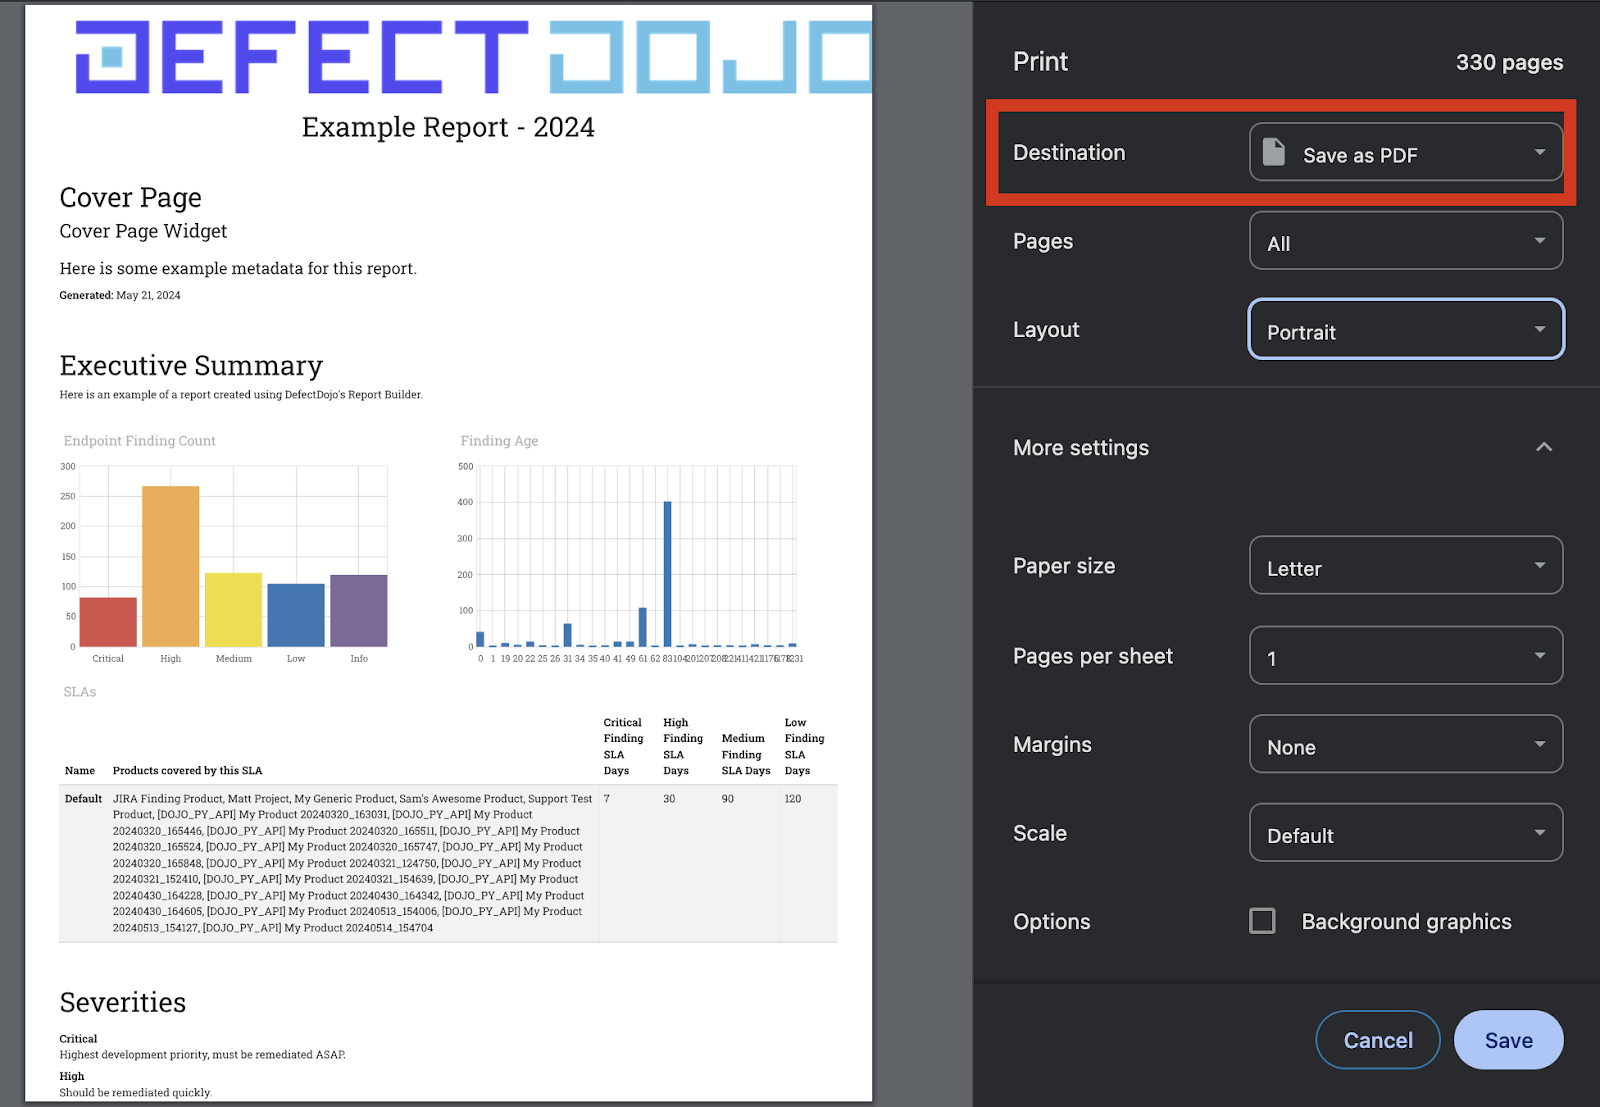
Step 4: Export the report
Reports are set up so that they can be exported or printed easily.
The simplest method is to print to PDF. With the HTML report open, open a Print dialog in your browser and set Save to PDF as the Print Destination.
Report formatting suggestions
- WYSIWYG sections can be used to contextualize or summarize Finding lists. Consider using this widget throughout your report, in between Findings or Vulnerable Endpoints widgets.
Report widget index
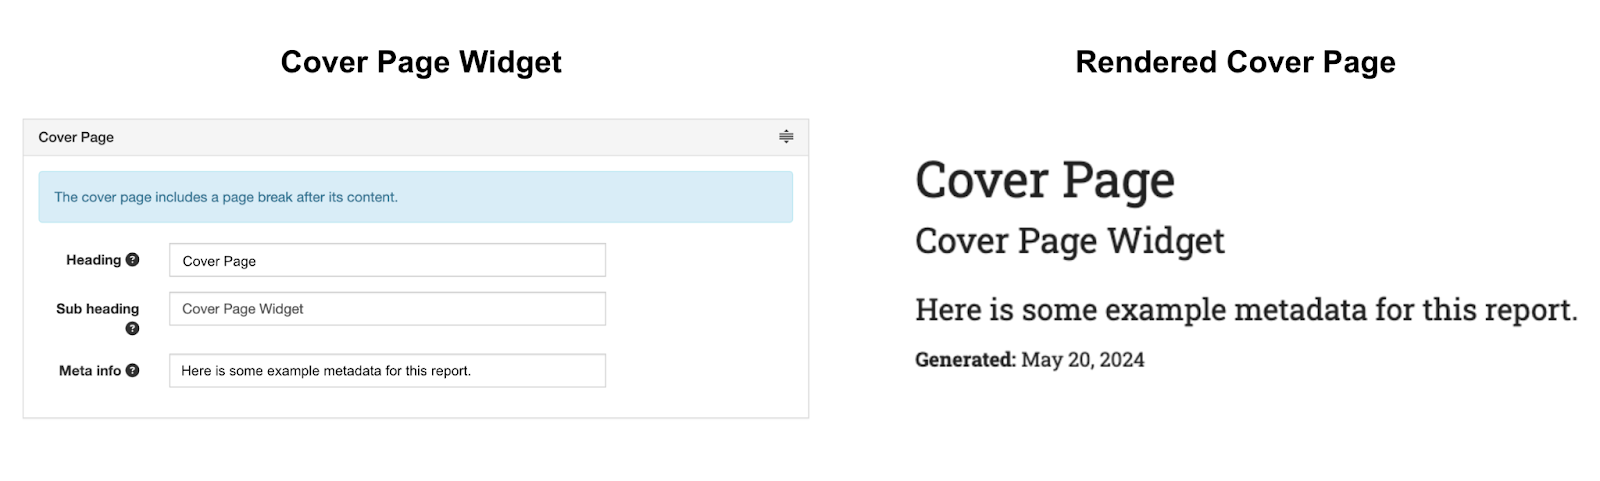
Cover Page widget
The Cover Page widget allows you to set a heading, sub-heading, and additional metadata for your report. You can only have a single Cover Page for a given report.
Executive Summary widget
The Executive Summary widget is intended to summarize your report at a glance. It contains a heading (defaults to Executive Summary), as well as a text box which can contain whatever information you feel is required to summarize the report.
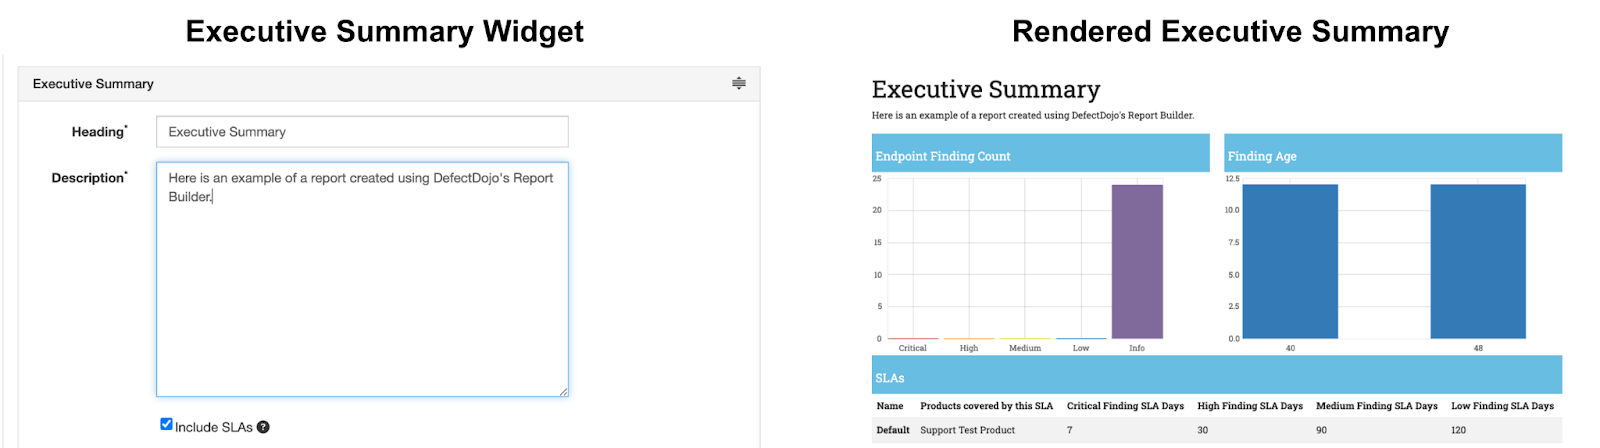
You can also Include SLAs in your executive summary. To add images, markup formatting, or anything beyond pure text, consider adding a WYSIWYG Content widget immediately after the executive summary.
- You can only have a single Executive Summary for a given report.
- If your report contains multiple SLA configurations (for example, you have Findings from separate Products which each have their own standards for SLA) each SLA configuration will be listed on the Executive Summary as a separate row.
Severities widget
As each organization will have different definitions for each severity level, the Severities widget allows you to define the severity levels used in your report for ease of understanding.
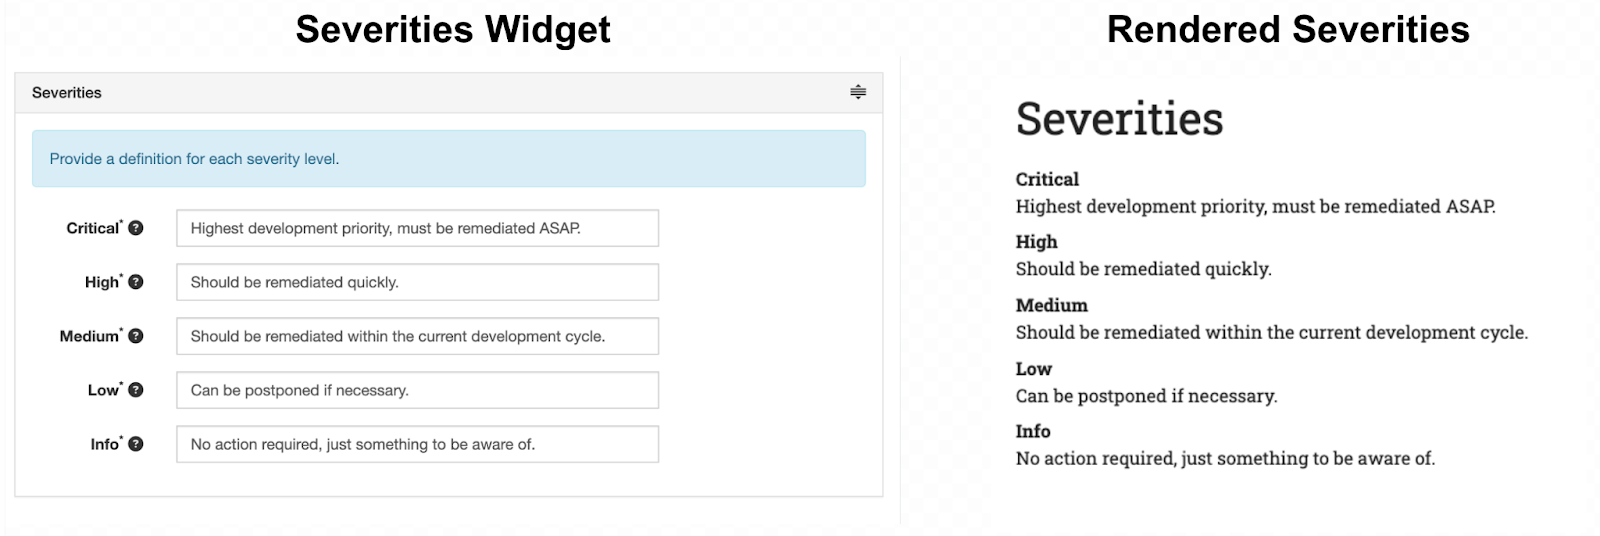
Table of Contents widget
The Table of Contents widget creates a list of each Finding in your report, for quicker access to specific Findings. The table of contents creates a separate heading for each severity contained within the report. Each Finding listed in the table of contents has an anchor link attached to quickly jump to the Finding in the report.
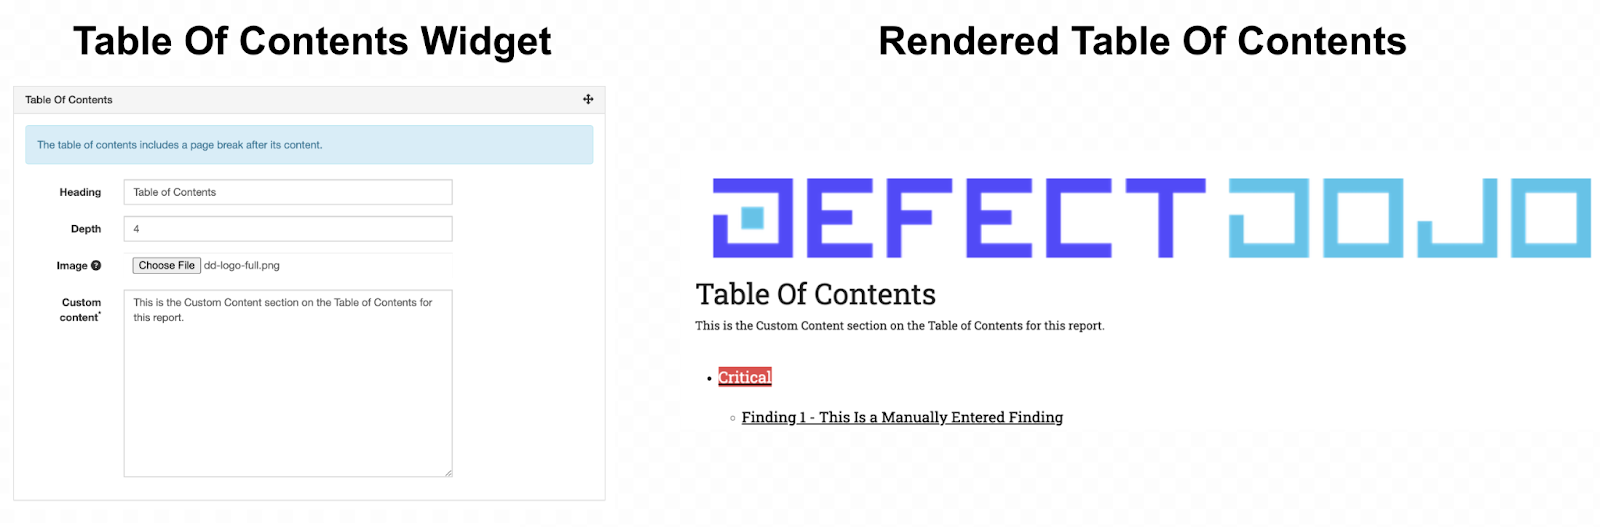
- You can add a section of Custom Content, which will add text underneath the heading.
- You can upload an image to the Table of Contents by clicking the Choose File button next to the Image line. The uploaded image will render directly above the heading selected. Images will be resized to fit the document.
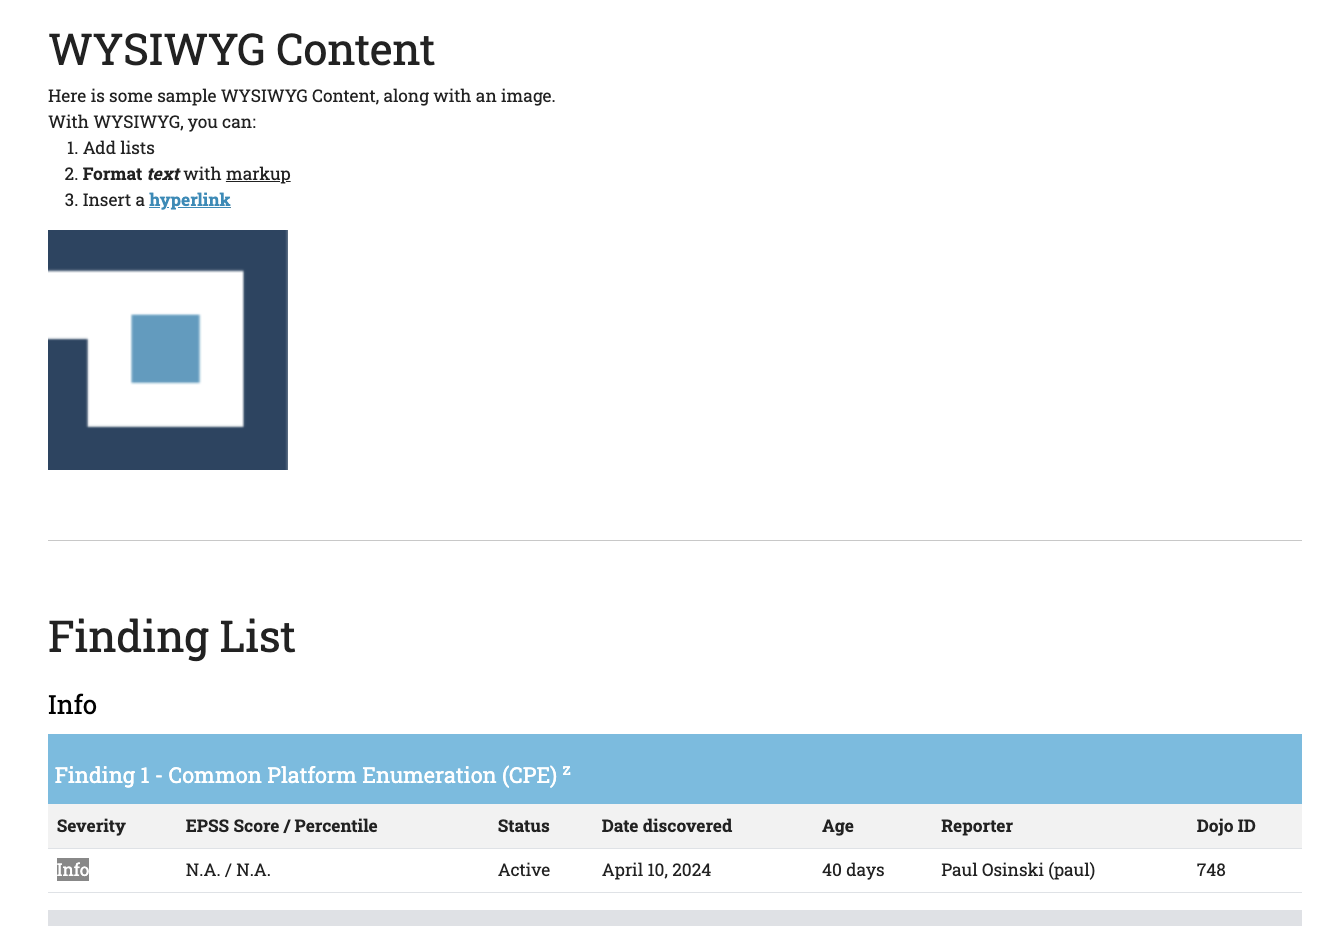
WYSIWYG Content widget
The WYSIWYG (What You See Is What You Get) widget can be used to add a section containing text and images in your report. Multiple copies of this widget can be added to provide context to other sections of your report.
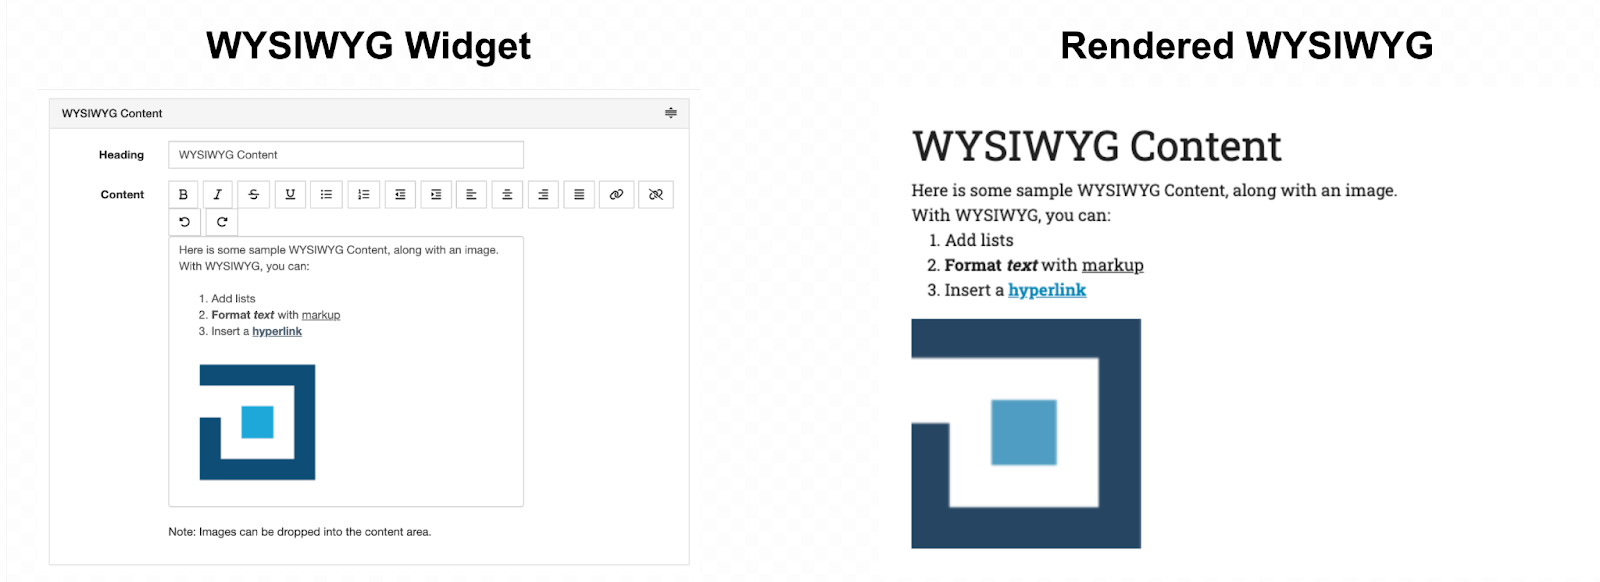
- WYSIWYG Content can include an optional heading.
- Images can be added to a WYSIWYG widget by dragging and dropping them directly into the Content box. Images inserted into the Content box will render at their full resolution.
- You can add multiple WYSIWYG widgets to a report.
Findings widget
The Findings widget provides a list and summary of each Finding you want to include in your report. You can set the scope of the Findings you wish to include with filters.
The Findings widget is divided into two sections. The upper section contains a list of filters which can be used to determine which Findings you want to include, and the lower section contains the resulting list of Findings after filters are applied.
To apply filters to your Findings widget, set the filter parameters and click the Apply Filter button at the bottom. You can preview the results of your filter by checking the Findings list located underneath the Filters section.
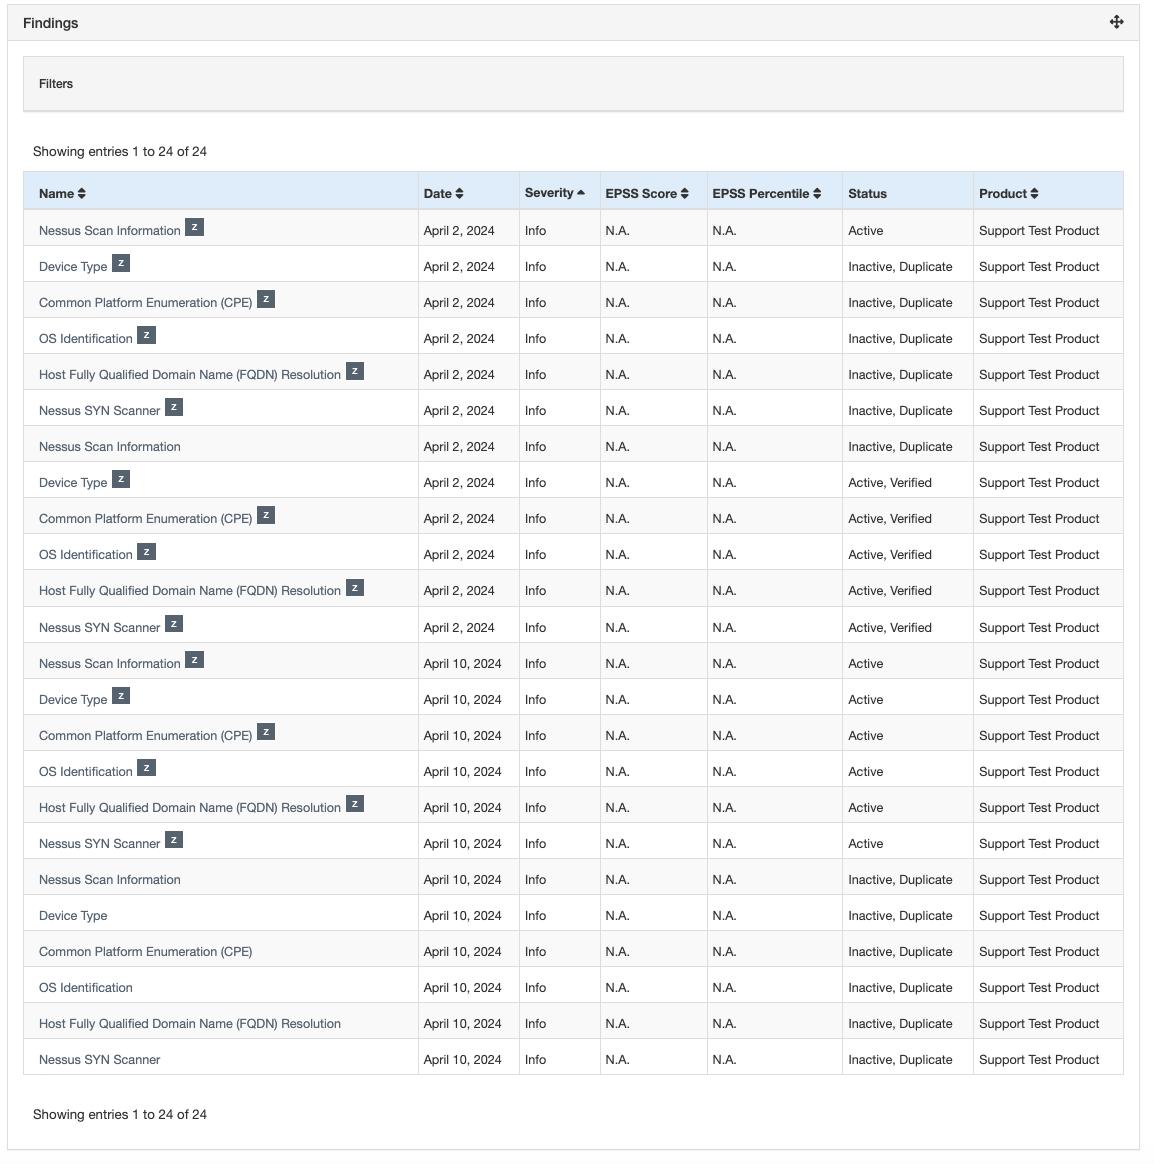
- As with widgets, the Filters section can be expanded and collapsed by clicking the grey Filters header.
- You can add multiple separate Findings widgets to your report with different filter parameters if you want the report to contain more than one list of Findings.
- Only the Findings you are authorized to view are included in these listings, with respect to Role-Based Access Control.
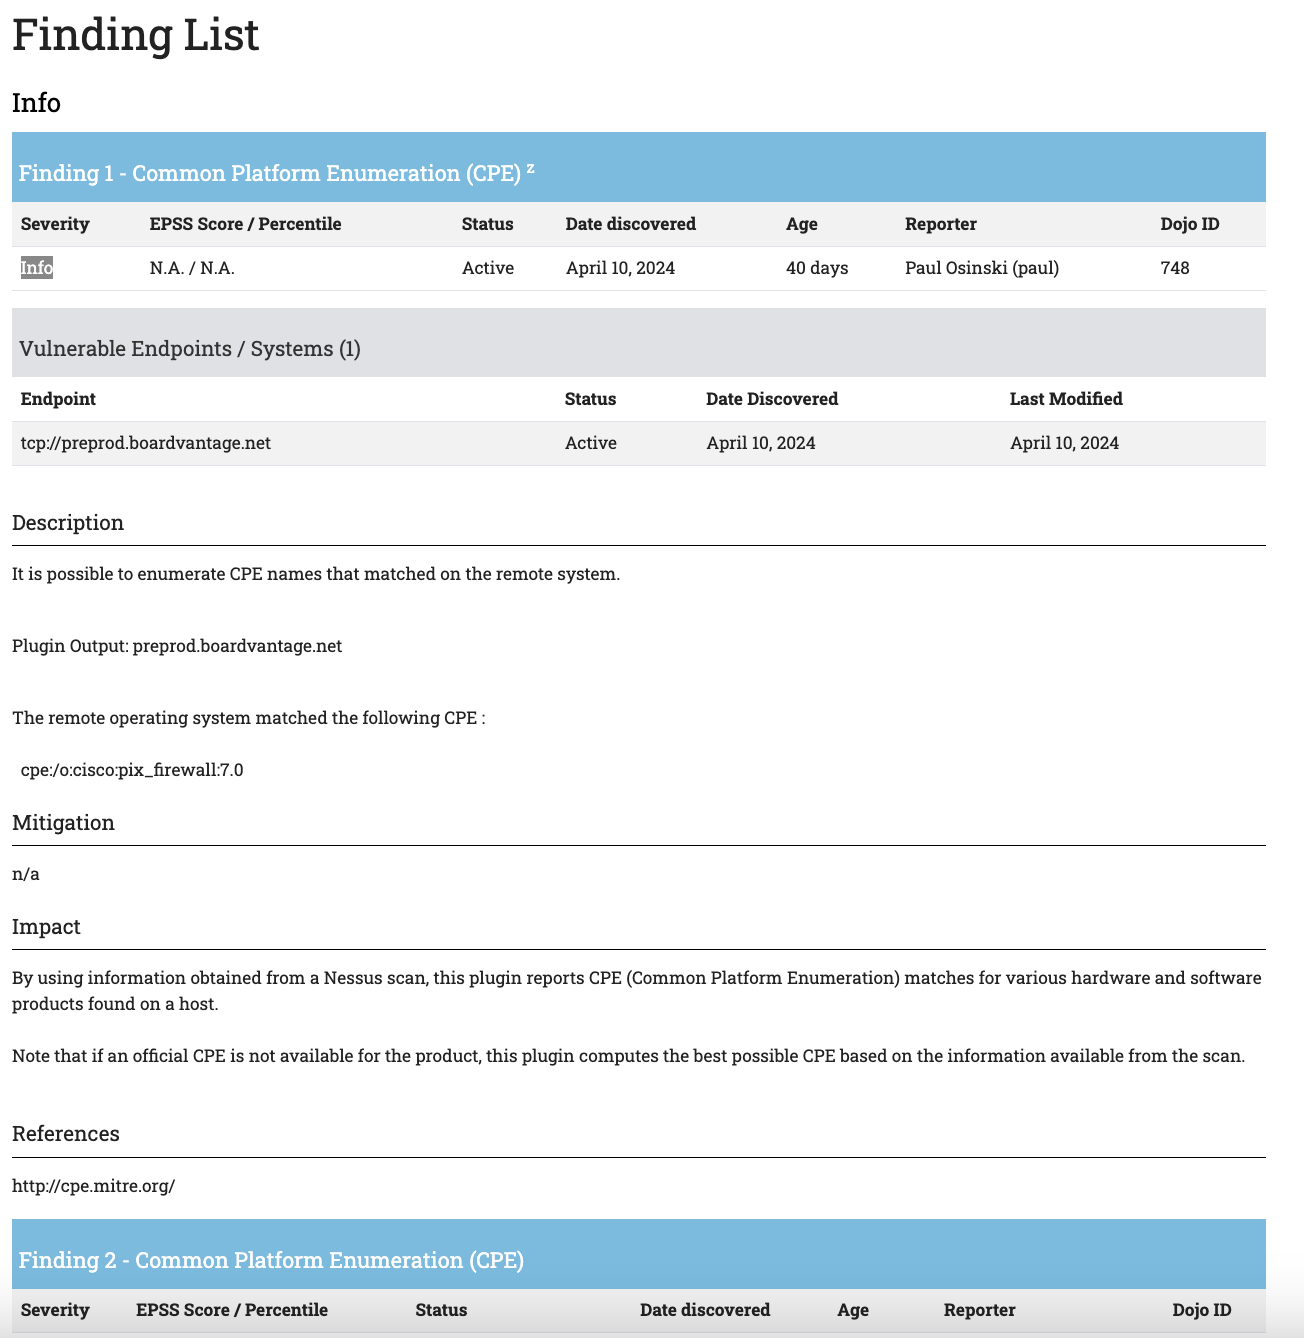
Example rendered Finding list
Vulnerable Endpoints widget
The Vulnerable Endpoints widget is similar to the Findings widget. You can use this widget to list all Findings for specific Endpoints, and sort the Finding list by Endpoint instead of by severity level.
The Vulnerable Endpoints widget lists each active Finding for the Endpoints selected. Rather than creating a single list of unsorted Findings, this feature separates them into their Endpoint context.
As with the Findings widget, the Vulnerable Endpoints widget is divided into a Filter section and a list of resulting Endpoints from the filter parameters.
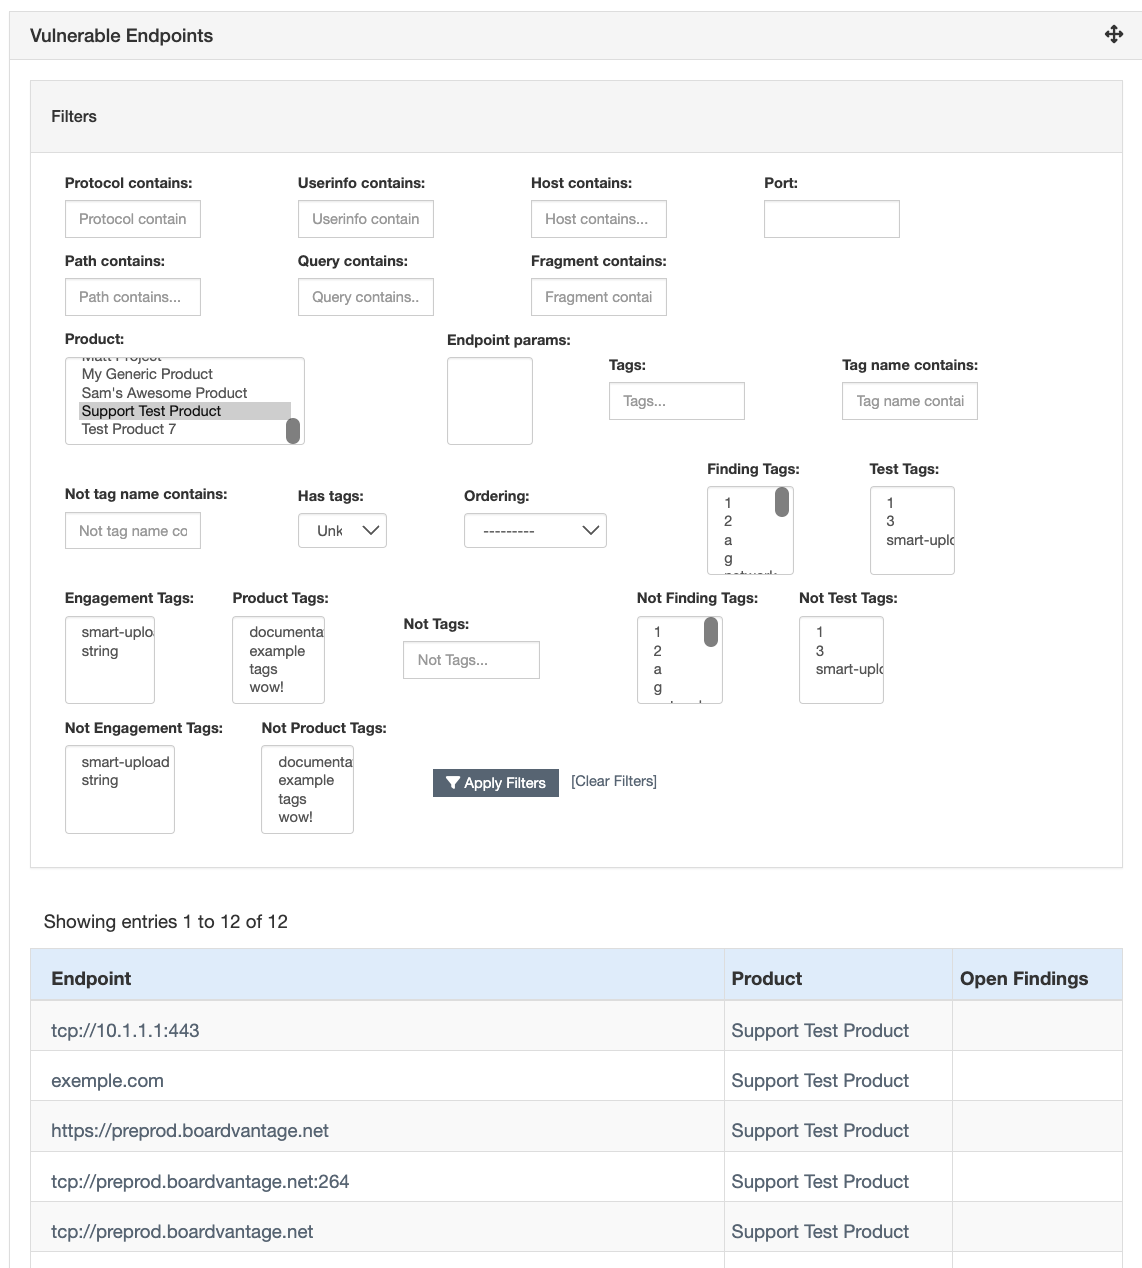
Select the parameters for the Endpoints you wish to include here and click the Apply Findings button at the bottom. You can preview the results of your filter by checking the Endpoints list located underneath the Filters section.
- You can add multiple separate Vulnerable Endpoints widgets to your report with different filter parameters if you want the report to contain more than one list.
- Only the Findings you are authorized to view are included in these listings, with respect to Role-Based Access Control.
—- (separator) widget
This widget renders a light grey horizontal line to divide between sections.