

Report Builder (Pro)
Note: The reusable Report Builder (Themes, Blocks, Templates, and saved Generated Reports) is a DefectDojo Pro feature, currently in beta.
The DefectDojo Pro Report Builder lets you compose polished reports out of reusable parts, so you can build the pieces once and reuse them everywhere instead of rebuilding a report from scratch each time. You reach it from the 📄 Reporting area in the sidebar.
How it compares to open source
Open source DefectDojo can build a report, run it, and let you retrieve the output, but it does not save report templates or persist the reports you generate. Each report is a one-time effort.
DefectDojo Pro turns reporting into reusable building blocks. You save Themes, Blocks, and Templates that you can mix, match, and reuse, and every report you run is persisted as a Generated Report you can download or re-run later. Pro also exposes the entire workflow through a full REST API and supports LLM-assisted authoring, so reports can be built and run programmatically.
💡 Tip: If you are using open source DefectDojo, see the open source report builder instead.
Core concepts
The Report Builder is made of four pieces, each available as a REST resource under /api/v2/: report_themes, report_blocks, report_templates, and generated_reports. Understanding how they fit together is the key to building reports efficiently.
Themes
A Theme controls the visual style and branding of a report: the colors, the header and footer imagery, and the footer text. By defining a Theme once, you can apply consistent corporate branding to every report you produce.
A Theme has the following settings:
| Setting | Purpose | Default |
|---|---|---|
| Name | A label for the Theme | — |
| Primary color | Main brand color | #1e3a5f |
| Secondary color | Supporting brand color | #4a90a4 |
| Accent color | Highlight color | #e67e22 |
| Text color | Body text color | #333333 |
| Background color | Page background color | #ffffff |
| Footer text | Text shown in the page footer | — |
| Show page numbers | Whether to print page numbers | On |
| Header image | Image displayed in the header | — |
| Footer image | Image displayed in the footer | — |
💡 Tip: All five colors are expressed as 7-character hex values (for example,
#1e3a5f), so you can match your organization’s exact brand palette.
You can build this in the UI (below) or automate it with the API.
Blocks
A Block is a reusable unit of content. You build a Block once, configure what it shows, and then drop it into as many Templates as you like. There are five block types:
| Block type | What it produces |
|---|---|
| Stock | Non-data content such as a cover page, a table of contents, a page break, an image, or a text block. |
| Tabular | A table of records drawn from a single entity. |
| Detail | A per-record layout, best for long-form fields that render as markdown (for example, description, impact, mitigation, and references). |
| Chart | A single chart, chosen from the same catalog of charts used on the Insights dashboards. |
| Widget | A dashboard widget, rendered in the report. Requires Customizable Dashboards. |
A Stock block is configured by choosing one of five stock types, along with a title, subtitle, text content, or image as appropriate:
- Cover page
- Table of contents
- Page break
- Image
- Text block
Tabular and Detail blocks both pull live records from one entity. You pick the entity with a model choice, then select which fields to include and how to order the records. The model choice is exactly one of these seven entities:
- Organization
- Asset
- Engagement
- Test
- Finding
- Test type
- Risk acceptance
💡 Tip: In DefectDojo Pro, Assets were formerly called Products and Organizations were formerly Product Types. You may still encounter the legacy wording in some underlying field and filter names.
The difference is presentation: a Tabular block lays the records out as a table of columns, which is ideal for summaries and inventories, while a Detail block renders one record at a time in a long-form layout that is best suited to markdown-rich fields like description, impact, mitigation, and references.
Fields render in the order they are listed. Selecting a field adds it to the end of the list, and the Fields section of the block editor shows the selection as a numbered list you can rearrange: drag a field by its handle, or use the arrow buttons to move it up or down. Removing a field from that list deselects it. Columns in a Tabular block, and the label and value pairs in a Detail block, follow this order when the report is generated.
When Locations are enabled, each of the Organization, Asset, Engagement, Test, and Finding entities offers a Location Count field. An Asset counts the locations it references directly and a Finding counts the locations attached to it. An Organization rolls up the distinct locations across its Assets, and an Engagement or Test counts the distinct locations touched by its Findings, so a host shared by several findings counts once. The counts respect the viewer’s permissions, so a user who can only see some Assets in an Organization sees only those Assets’ locations in its count.
A Chart block draws one chart from the catalog below — the same charts the Insights dashboards use, so a figure in a report matches the figure your team already reads on screen. You choose the chart, and the chart decides what it can be filtered by:
- Charts of findings expose the Finding filter, and the filter narrows the findings the chart counts.
- Charts of assets expose the Asset filter, and the filter selects assets, scoping the chart to the findings belonging to them.
- Portfolio-wide charts take no filter, because they summarize the whole instance by design.
| Chart | What it shows |
|---|---|
| Active Findings by Severity | Open findings over time, split by severity |
| Active, Mitigated, and Risk Accepted Findings | Finding status mix over time |
| Average Finding Age by Severity | Mean age in days of the findings currently open, per severity |
| Average Finding Age by Risk | The same, grouped by risk category |
| Average Time to Remediation | Mean days from discovery to mitigation, over time |
| Findings Fixed Over Time | Count of findings mitigated in each period |
| Tests Performed Over Time | Count of tests recorded in each period |
| Average Risk Over Time | Mean risk score across open findings, over time |
| Total Findings by Risk Category | Open findings split across the four risk categories |
| Finding Priority Distribution | Open findings bucketed by priority score |
| Open Findings Over Time | Running total of open findings |
| Noise Reduction by Category | Ingested findings split into actionable, duplicate, false positive, and reimport automation |
| Noise Reduction / Hours Saved Over Time | The same categories per period, with estimated hours saved |
| Findings Past SLA by Asset | Findings past their SLA, sized per asset |
| Findings Past SLA by Organization | The same, grouped by organization |
| Severity of Findings Past SLA by Asset | Past-SLA findings per asset, broken out by severity |
| Assets Tested Over Time | Count of distinct assets tested in each period |
Charts appear in Block and Template previews and in the reports you generate, in both HTML and PDF output. Reports created through the API, and reports delivered automatically by a rule, include their charts as well.
💡 Tip: A Chart block carries its filters like any other Block, so the same chart filtered two ways is two Blocks. Duplicate the Block and adjust the copy rather than editing one shared Block.
Widget blocks
A Widget block puts a Customizable Dashboards widget into a report. It is the same widget, configured by the same settings dialog you use on a dashboard, filters included, so a figure your team already reads on screen can go into the document you send out without being rebuilt.
The block type appears only while Customizable Dashboards is enabled, because everything that configures a widget lives there. A Widget block saved earlier keeps working and keeps generating if the feature is later turned off.
Choose a widget, then click Configure Widget to open that widget’s own settings, exactly as you would from the gear icon on a dashboard tile. A Widget block keeps its filters inside the widget’s settings rather than in the Block’s own filter table, which is why that table is not shown for this block type.
Not every widget can go in a report, and the picker lists only the ones that can. How each one is drawn depends on the widget:
| Widget | Drawn as |
|---|---|
| Count | A headline number |
| MTTR / MTTD | A pair of headline numbers, in days |
| Gauge | A threshold-banded arc with the percentage in the middle |
| Graph | A bar, line, area, pie, or doughnut chart, as configured |
| Finding Velocity | A line chart of findings created against findings closed |
| Vulnerability Aging | A bar chart of age bands, stacked by severity |
| Priority Histogram | A bar chart of priority bands |
| Portfolio Treemap | Area-proportional tiles |
| Rate by Category | A table of per-category rates |
| Top-N Leaderboard | A ranked table |
| Scan Coverage | A table of coverage per window |
Some widgets are left out on purpose. Widgets that are relative to whoever is looking (My Work, SLA Burndown, Recent Activity) would mean something different to every reader of the same PDF. License Usage requires the Maintainer role, which a report’s readers need not have. KPI / Trend is covered by a Count block for its headline number. A Table widget is what a Tabular block already does, and a Markdown widget is what a Stock text block is for.
Sankey, Sunburst, Risk Matrix, and Activity Heatmap cannot be drawn in a report yet.
💡 Tip: Widget blocks are drawn on the server in every case, so a Widget block looks the same whether you generated the report from the UI, through the API, or automatically from a rule. The Block preview shows exactly what the report will contain.
Moving a figure between a dashboard and a report
The two features share one widget catalog, so a figure can start on either side and move to the other. Both directions copy rather than link: the copy is what the original was at that moment, and editing either one afterwards does not change the other.
- From a dashboard into a report. Click the export icon on any widget that a report can draw and choose Add to Report. Name the block, optionally pick a Template to append it to, and it is created with the widget’s current filters.
- From a report onto a dashboard. Open the menu on a Chart or Widget block and choose Add to Dashboard, then pick which of your dashboards to add it to. You can also browse saved blocks from the dashboard side: in Add Widget, the From Reports tab lists your Chart and Widget blocks.
A Chart block that carries its own filters has no faithful dashboard equivalent, because a dashboard Insights Plot widget is scoped by a date window rather than by a filter set. Those blocks are refused rather than being placed on a dashboard with a wider scope than the block they came from.
💡 Tip: Filters live on the Block, not on the Template. A Block carries its own filters with it, so reusing a Block reuses its filters identically everywhere it appears. If you need the same content but with a different filter, duplicate the Block and adjust the copy.
You can build this in the UI (below) or automate it with the API.
Templates
A Template is an ordered list of Blocks bound to a single Theme. The Template defines what appears in the report and in what order, while the Theme it is bound to controls how it looks.
Because a Template references Blocks by inclusion, the same Block can appear in a Template more than once. A reusable page-break Block, for instance, can be inserted between several sections of the same report.
You can build this in the UI (below) or automate it with the API.
Generated Reports
Running a Template produces a Generated Report: a persisted PDF or HTML file that you can download and re-run on demand. Each Generated Report is frozen in time — it captures your DefectDojo data at the moment it was generated and does not update automatically when the underlying data later changes. To get a fresh snapshot, re-run the Template.
A Generated Report moves through these statuses as it is built:
| Status | Meaning |
|---|---|
| Pending | The report has been requested and is queued. |
| Processing | The report is being assembled. |
| Completed | The report is ready to download. |
| Failed | The report could not be generated. |
🔑 Important: Reporting is on by default. A superuser can turn it on or off from Settings > Feature Flags (see Feature Flags). Viewing respects DefectDojo’s role-based access control (RBAC) — users only ever see data they are authorized to view, even inside a report.
You can build this in the UI (below) or automate it with the API.
Building a report in the UI
The following steps walk through building a report end to end: create a Theme, create the Blocks that hold your content, assemble them into a Template, and generate the final report.
Step 1: Create a Theme
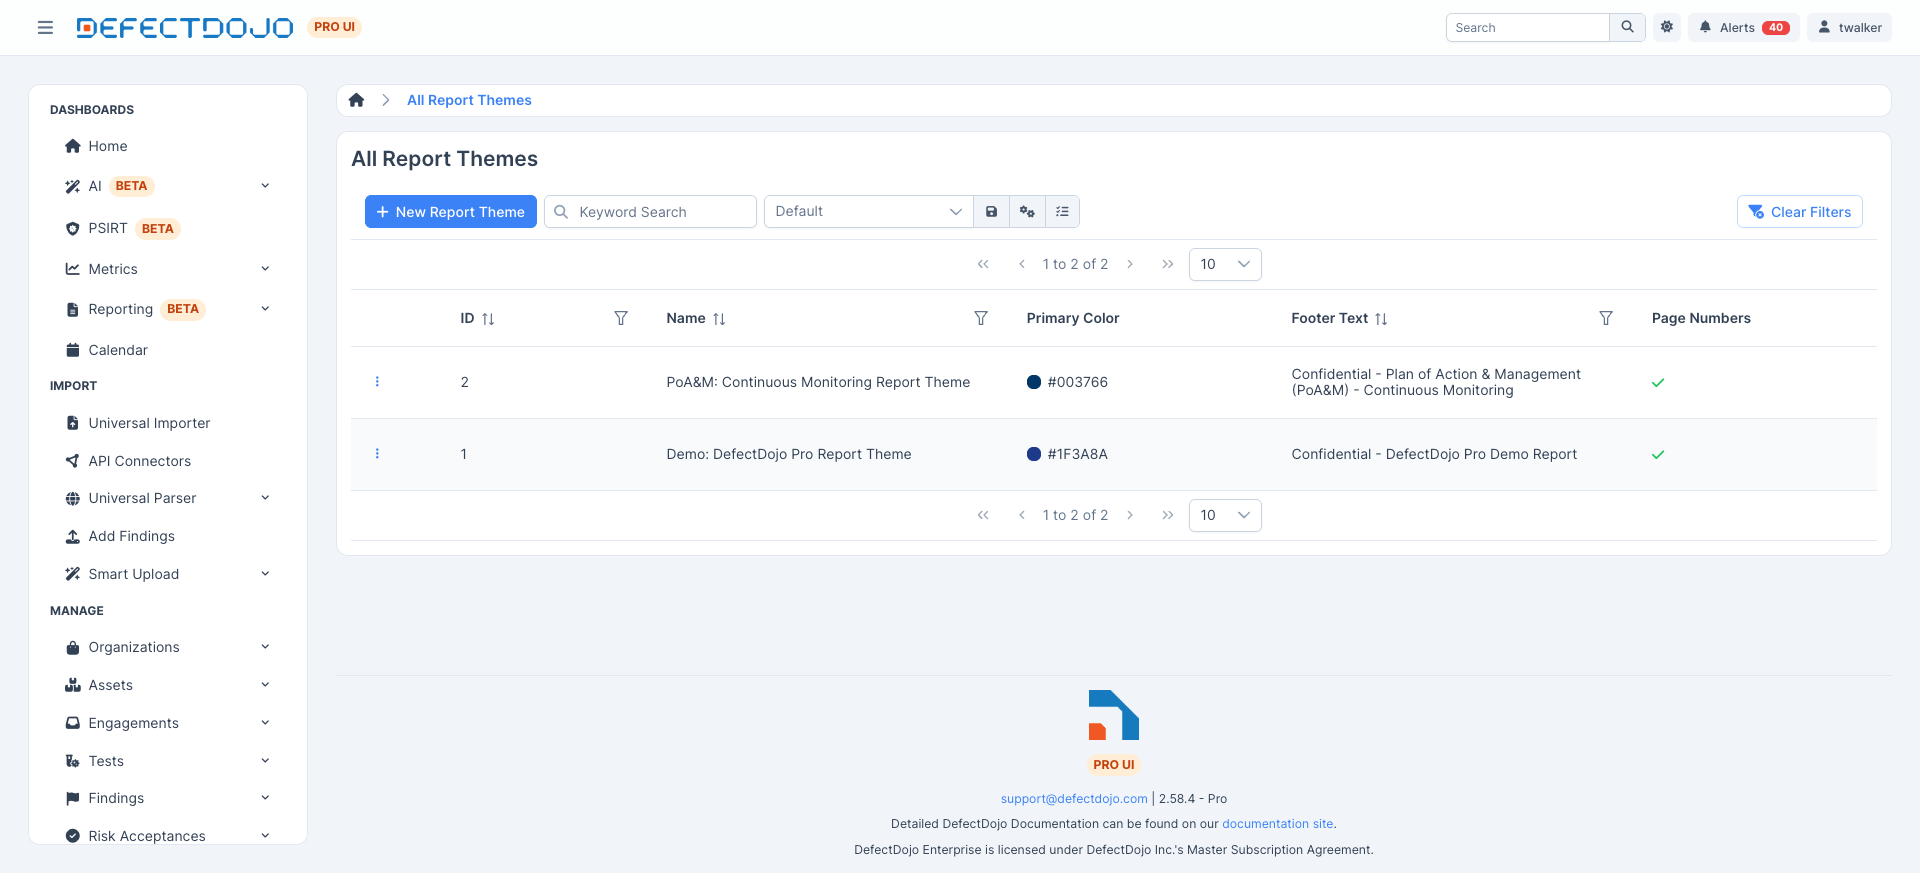
Start in the Themes area. The Themes list shows every Theme you have defined and lets you create a new one.
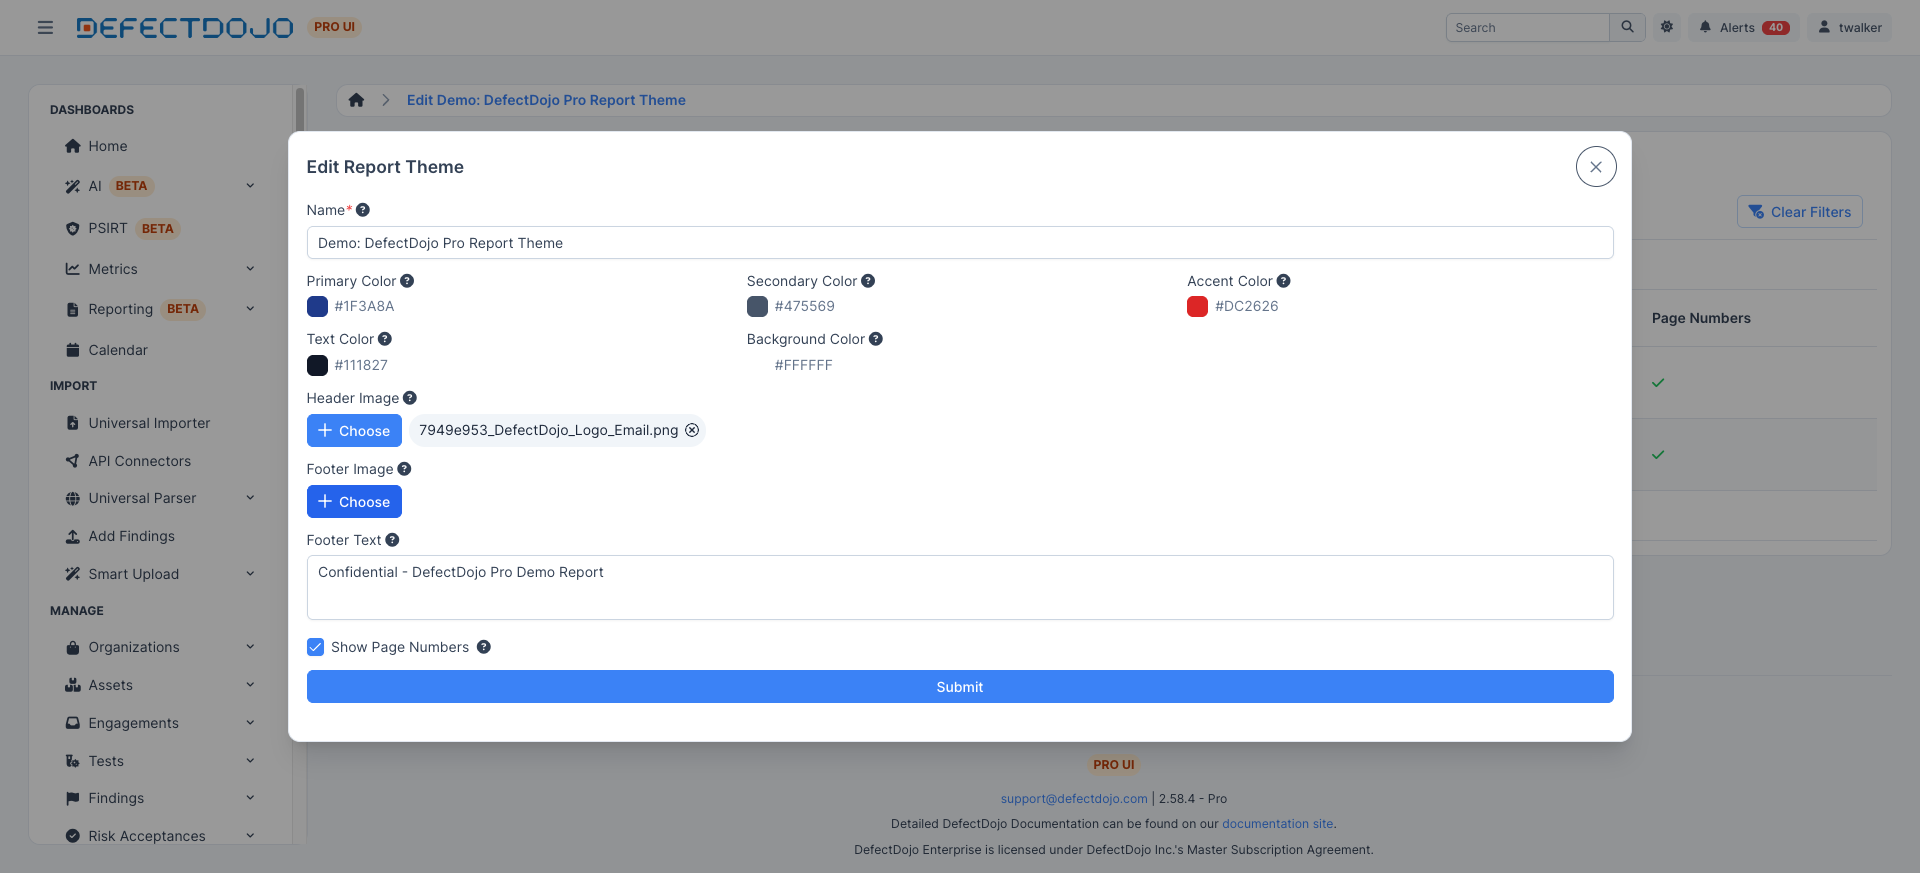
Open a new Theme to set its branding. The Theme form exposes the five colors, an optional header and footer image, the footer text, and the toggle for page numbers. Choose colors that match your organization’s brand so every report you produce looks consistent.
Step 2: Create Blocks
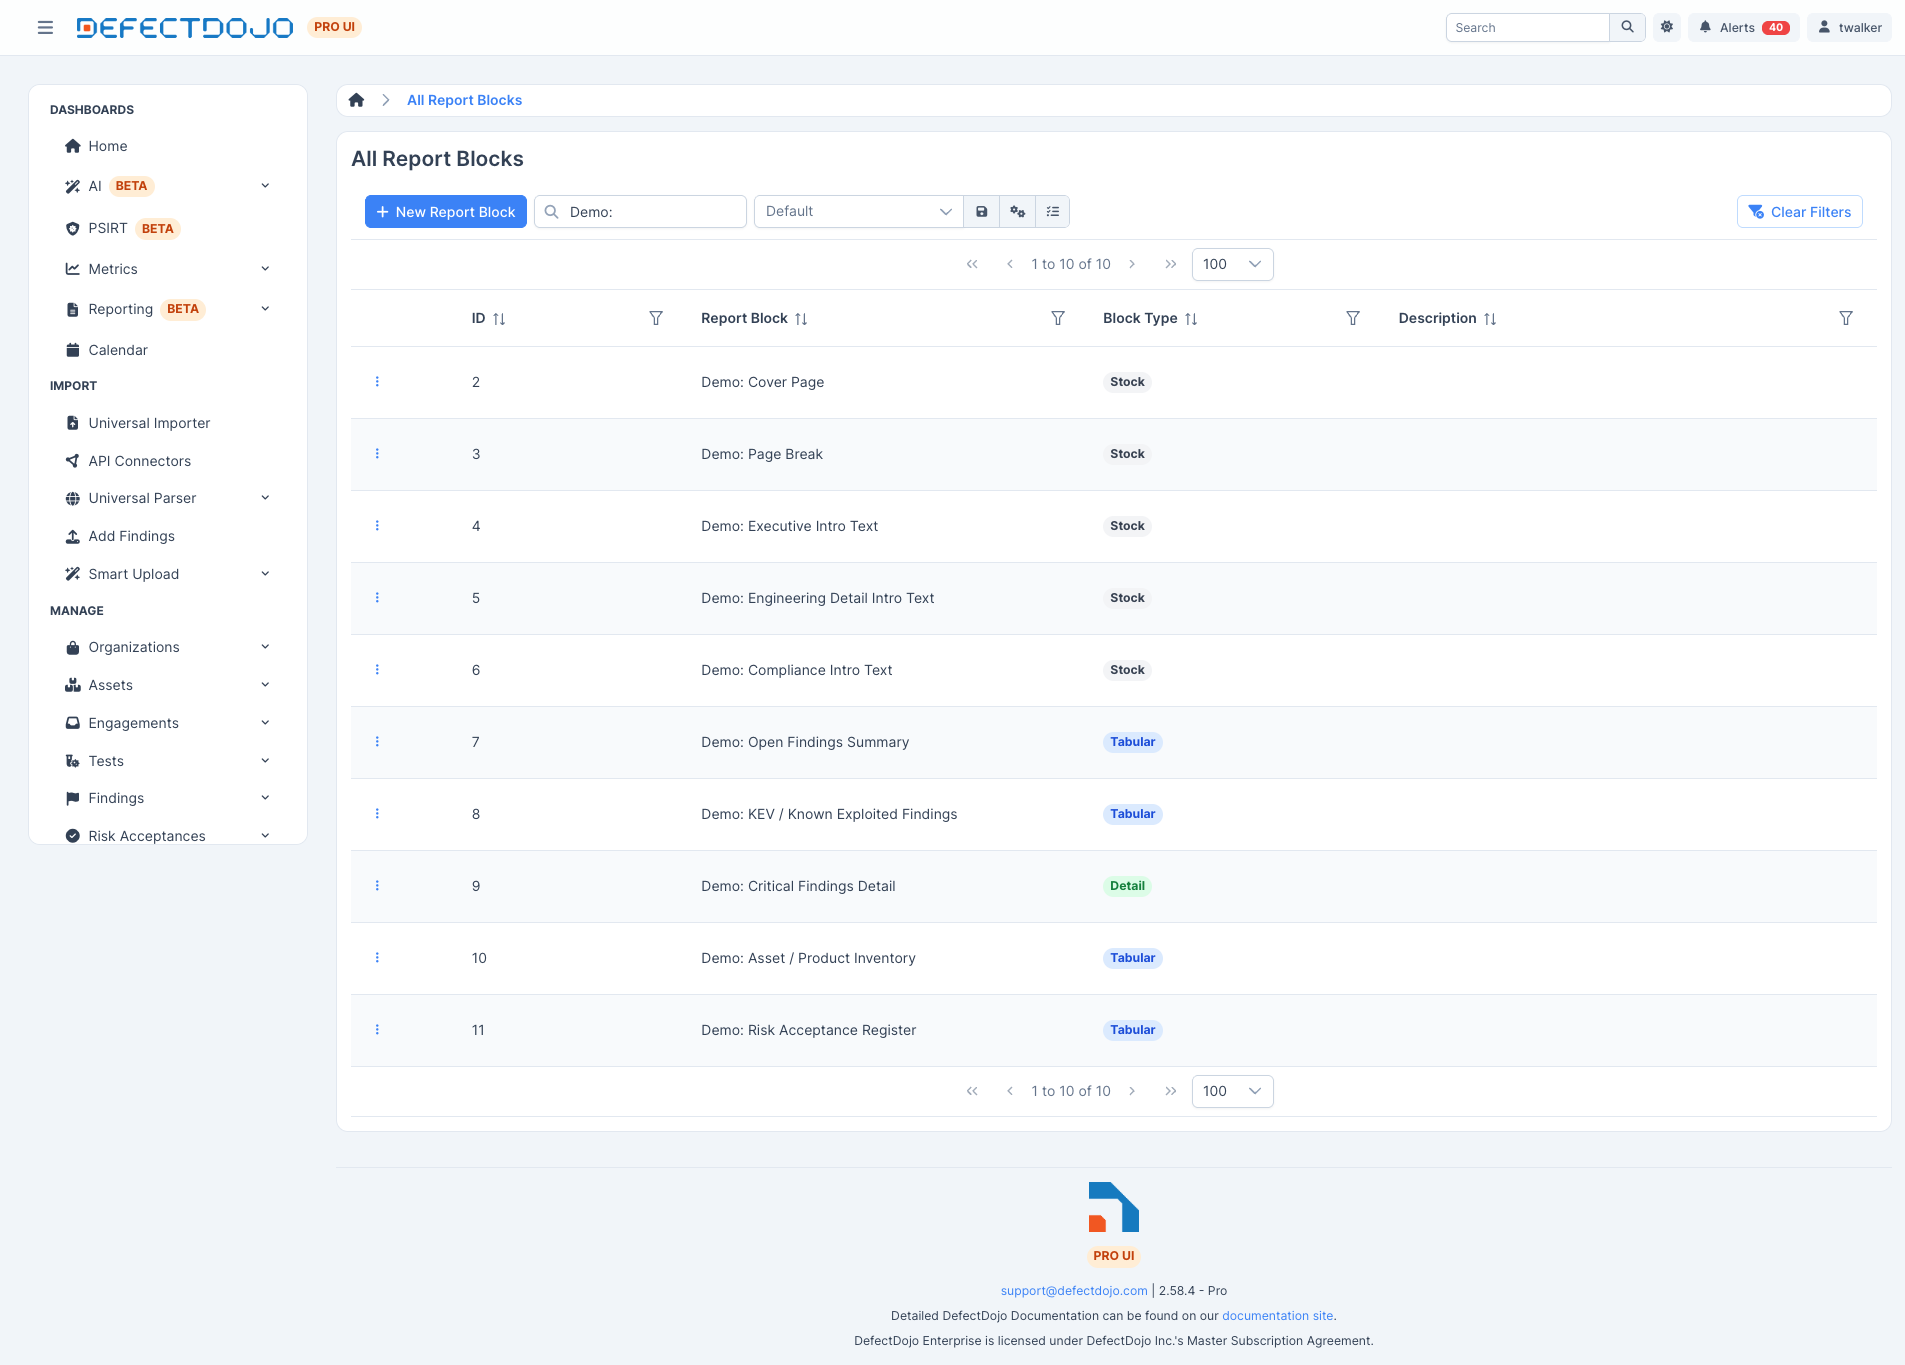
Next, build the content Blocks. The Blocks list shows all of your Blocks across every type.
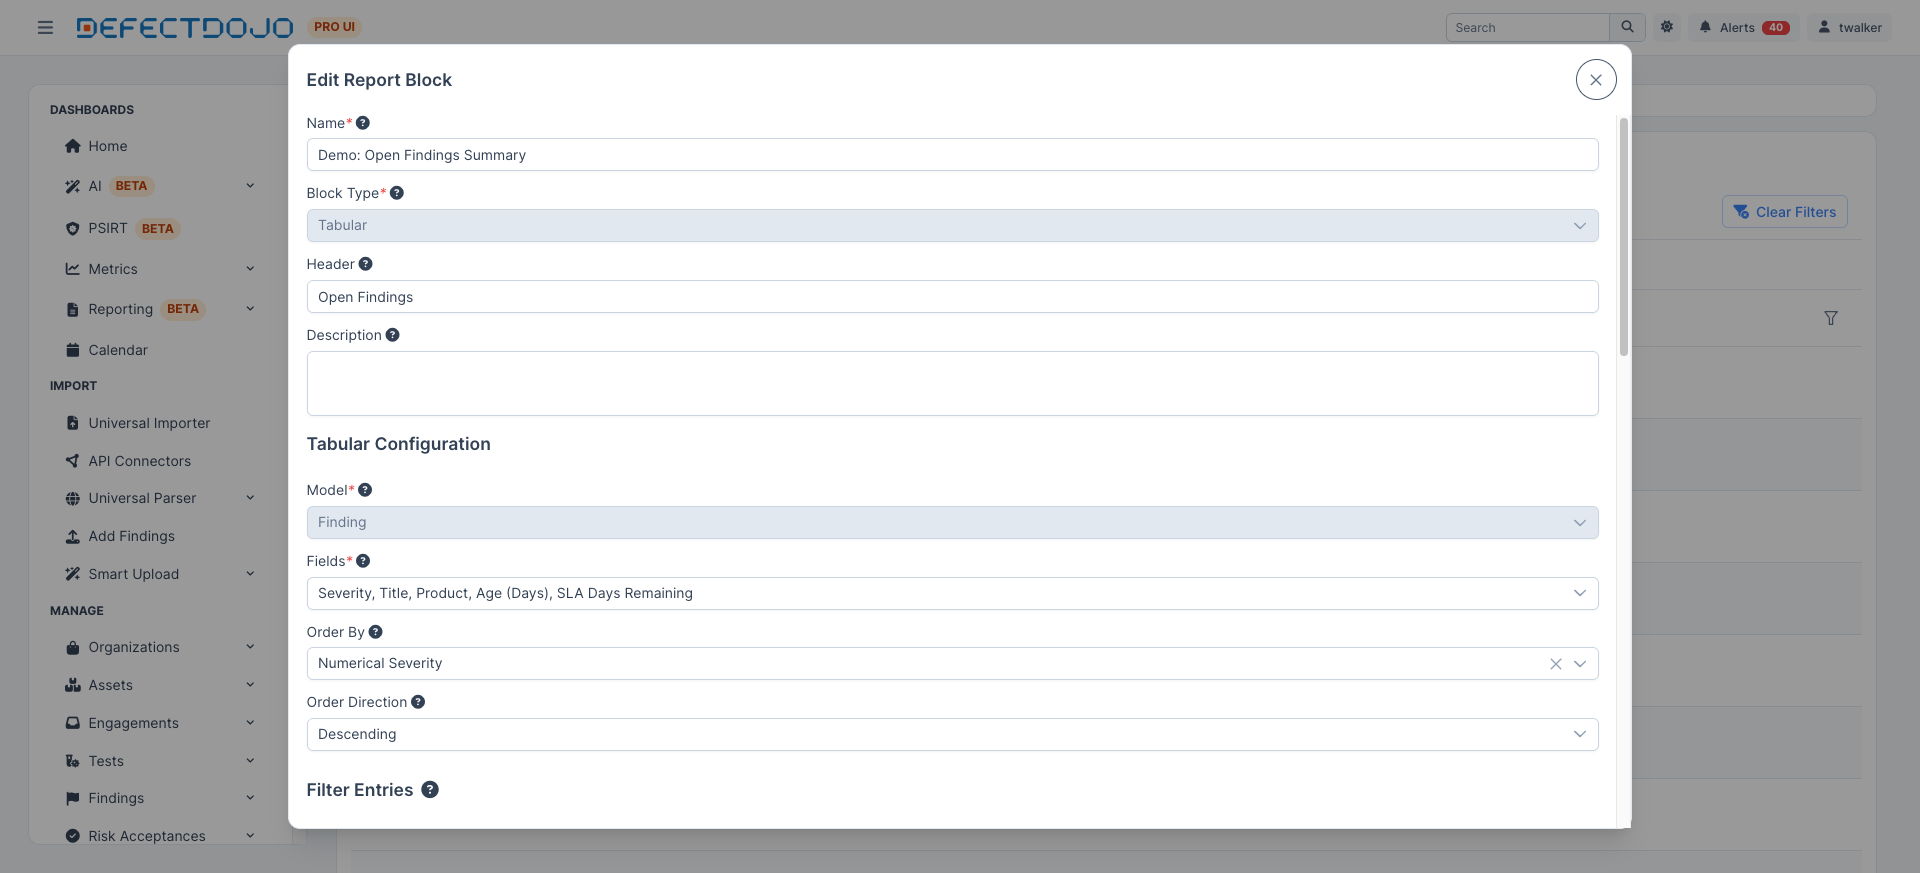
To create a data-driven Block, choose its type and configure it. The example below is a Tabular Block named for open findings: the Block Type is set to Tabular, a header is supplied, the Model is Finding, the selected fields are Severity, Title, Asset, Age (Days), and SLA Days Remaining, and the records are ordered by Numerical Severity in descending order. The selected fields appear as a numbered list under the field picker; drag them, or use the arrows, to set the column order without deselecting anything. Because filters live on the Block, the Filter Entries here scope exactly which records this Block will pull wherever it is used.
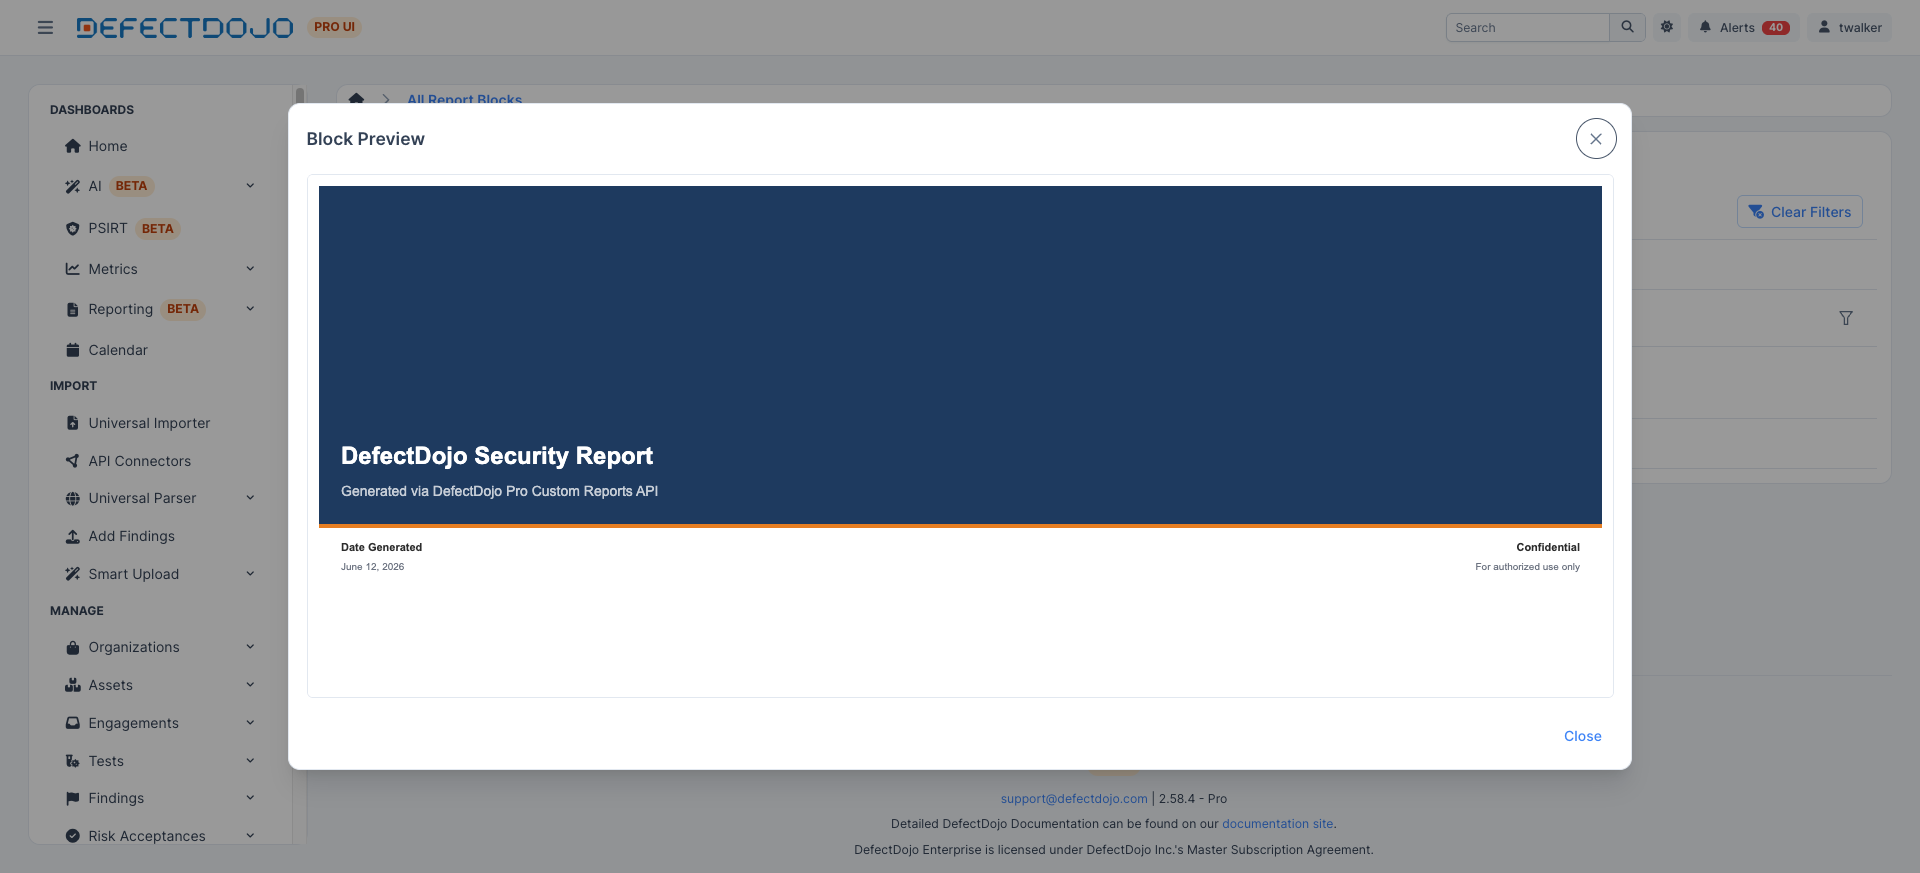
You can Preview a Block to see how it will render with a Theme applied before you commit it to a Template. The preview below shows a styled cover page (“DefectDojo Security Report”) picking up the Theme’s colors and branding.
💡 Tip: Use Duplicate to copy an existing Block when you need the same layout with a different filter. Since filters travel with the Block, duplicating is the right way to produce, say, a “Critical findings” table and a “High findings” table from the same column layout.
Step 3: Assemble a Template
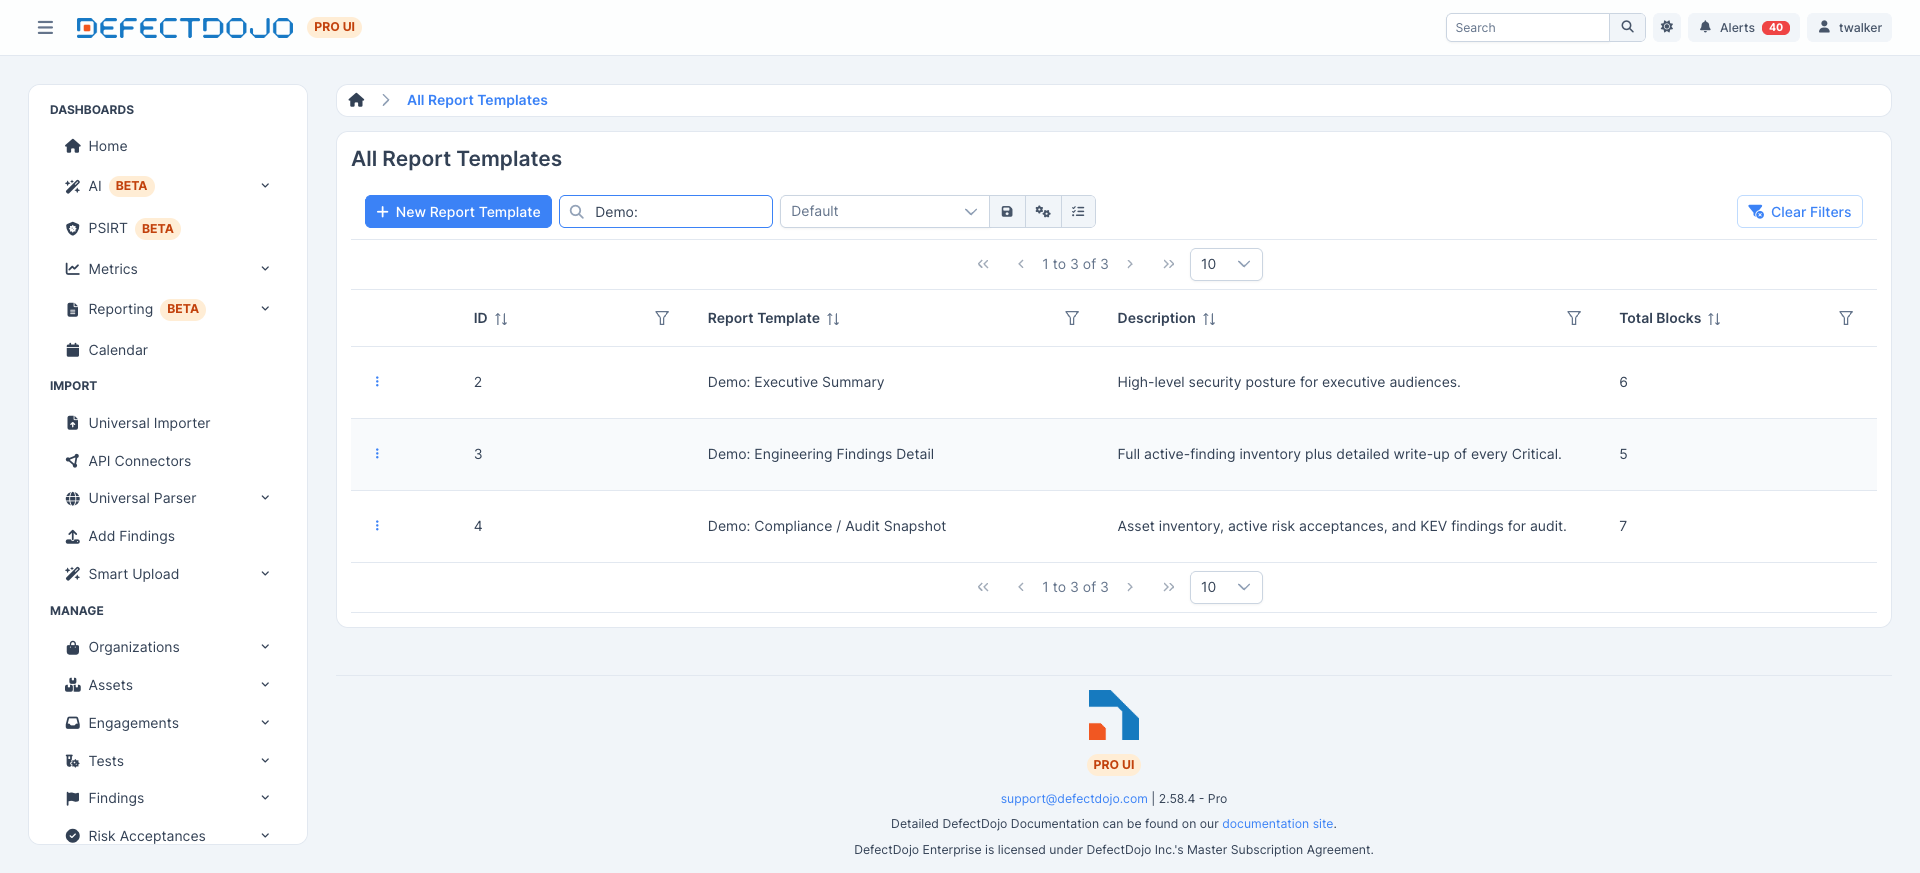
With your Blocks ready, build a Template. The Templates list shows your saved Templates.
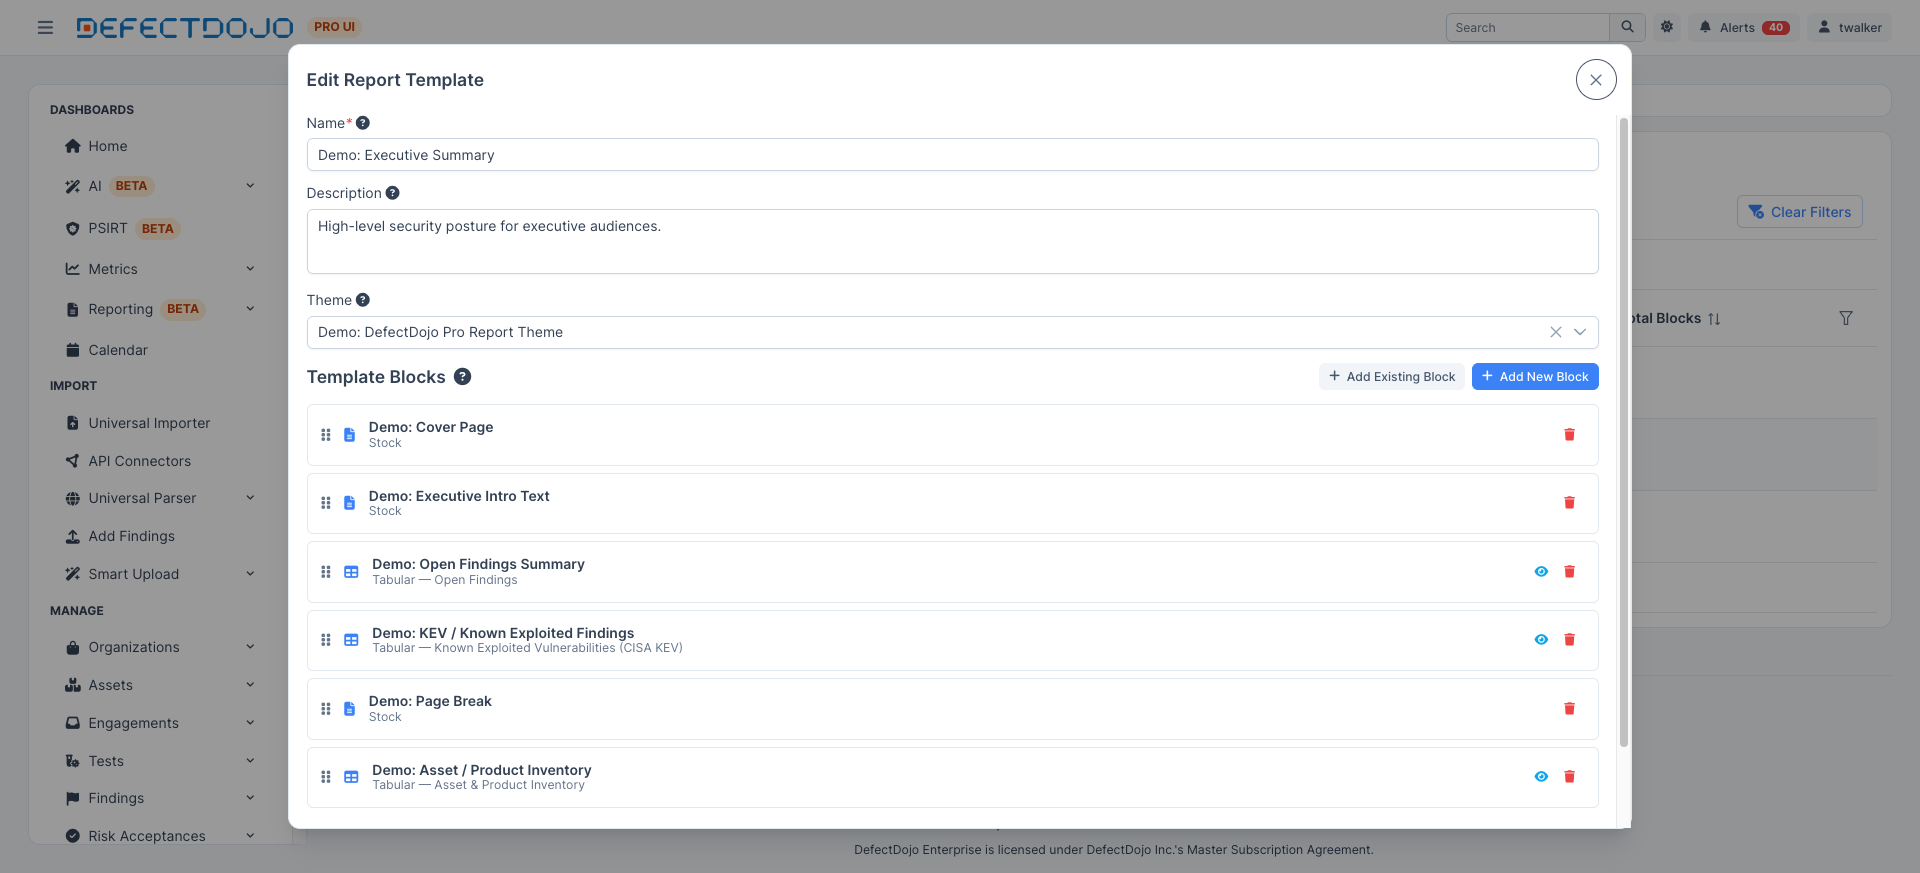
In the Template editor, you select a Theme and arrange the Blocks in the order they should appear. The example below sequences Cover Page → Executive Intro → Open Findings → KEV → Page Break → Asset Inventory. Use Add Existing Block to reuse a Block you already built, or Add New Block to create one on the spot, and use the drag handles to reorder. Remember that the same Block can appear more than once — a single page-break Block can be inserted between several sections.
Step 4: Generate and download
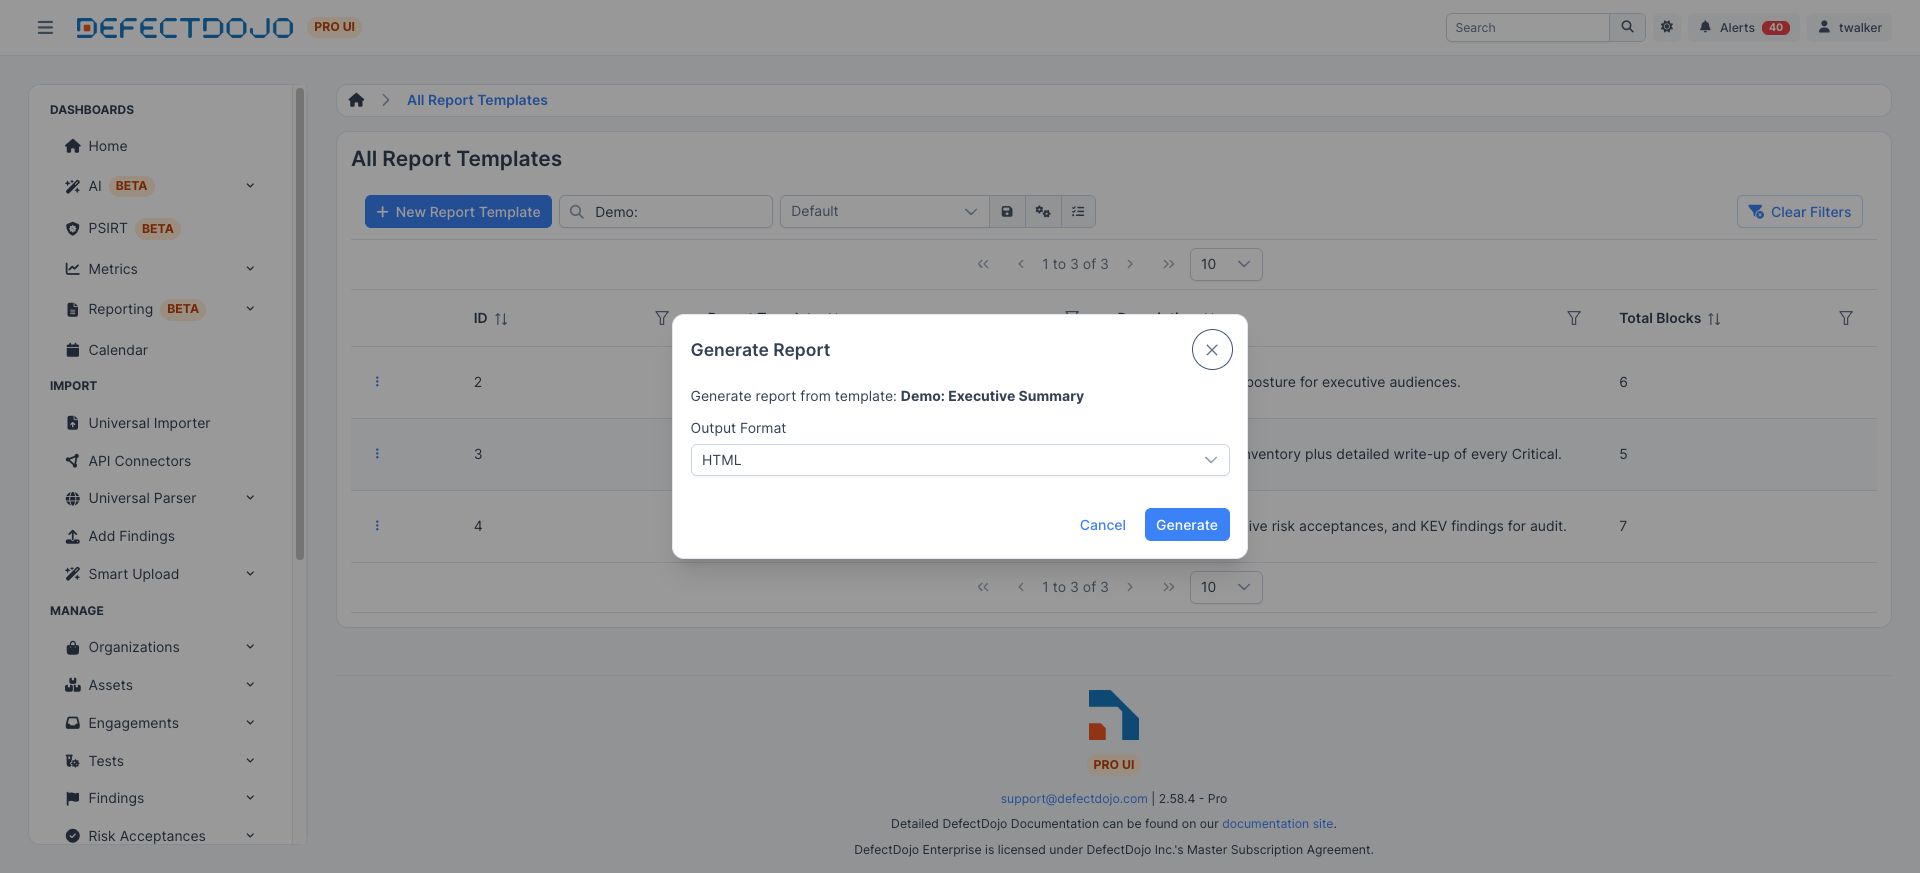
When the Template is ready, generate the report. The generate dialog confirms the Template and lets you choose the output format — HTML or PDF.
Generated reports are collected in the Generated Reports list, which shows each report’s status, file format, the time it was requested and completed, and a download link.
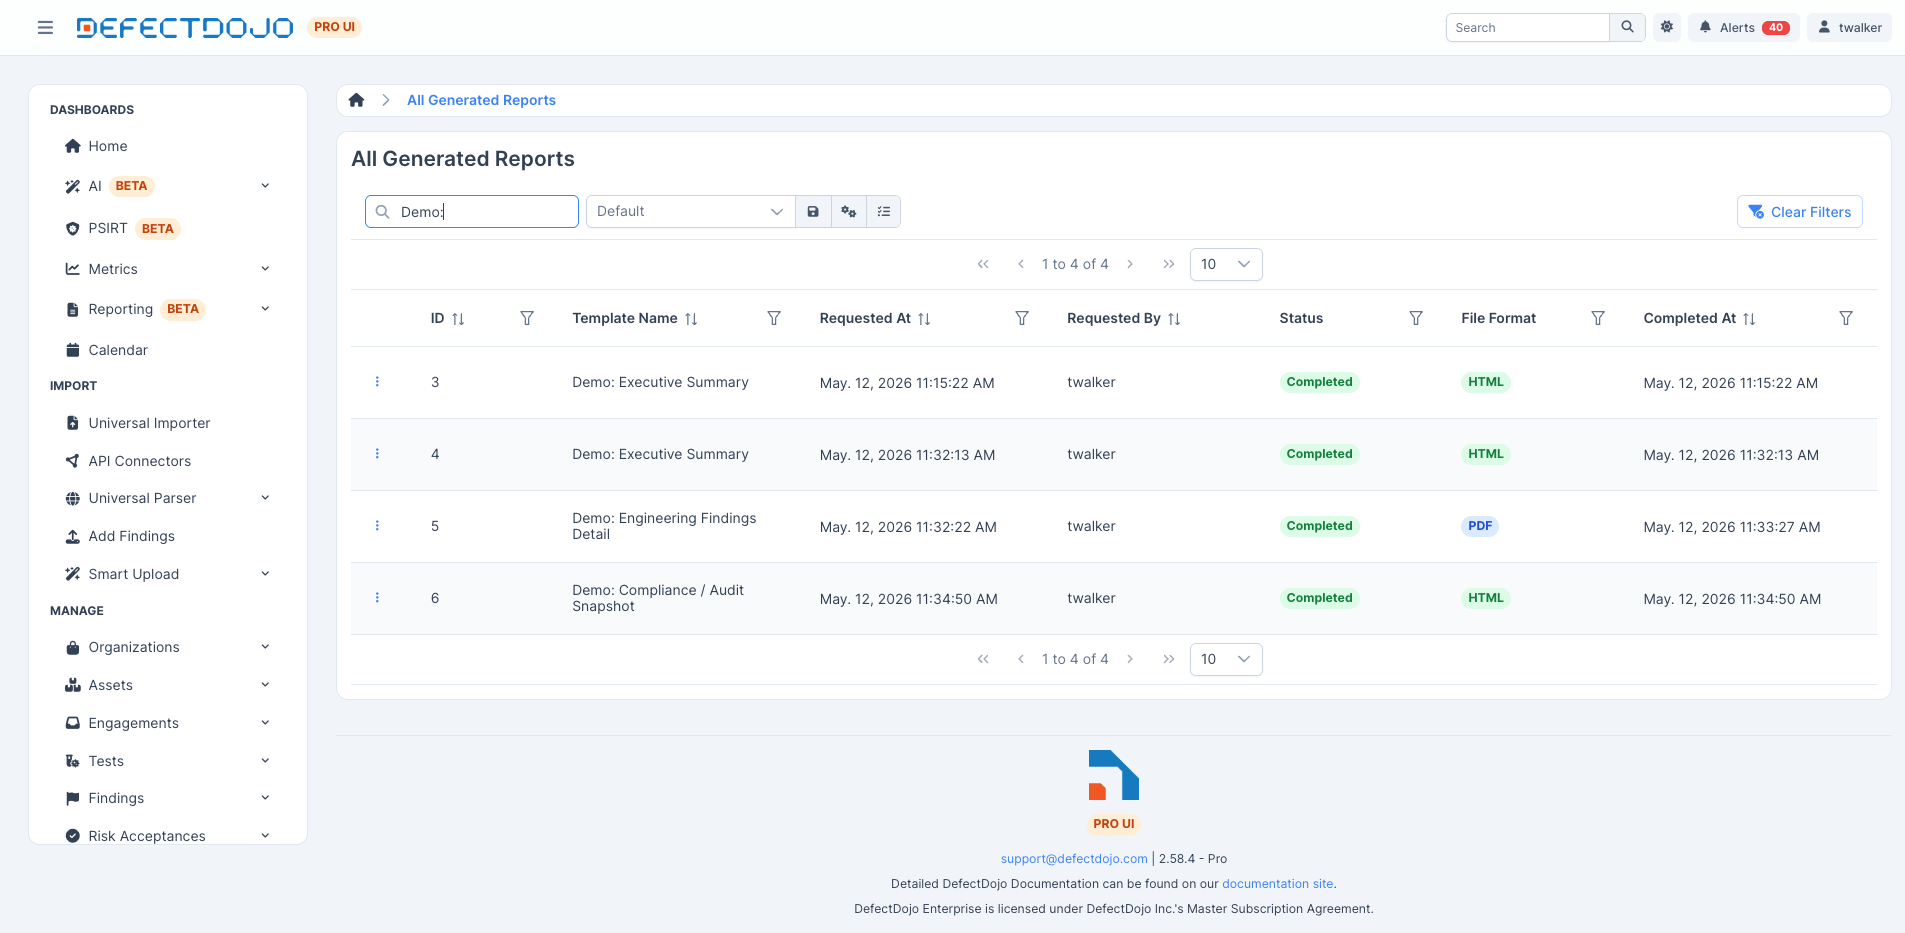
You can re-run a Template at any time to produce a fresh report. Keep in mind that each Generated Report is frozen in time — it reflects your data as of when it was generated and will not change as DefectDojo data changes, so re-run the Template whenever you need an up-to-date snapshot.
Moving off the classic report engine
The classic report engine — the Report Builder, Report Templates and Generated Reports pages listed under Classic Report Engine in the sidebar — is removed in 3.3.0 (September 8, 2026). Until then those pages carry a banner reminding you of the date, and both they and this Report Builder offer a one-click migration.
Migrating your saved templates
Use Migrate to the new engine on any classic page, or Import from Classic Engine on All Report Templates here. Both run the same conversion, so it does not matter which you start from, and both are safe to run more than once: a classic template whose name already exists here is reported as already migrated rather than duplicated.
Each classic widget becomes a Block:
| Classic widget | Becomes |
|---|---|
| Cover Page | Cover Page stock Block |
| Table Of Contents | Table of Contents stock Block |
| Page Break | Page Break stock Block |
| Custom Content / WYSIWYG | Text Block |
| Findings | Tabular Block over Findings, keeping the widget’s filters |
| Vulnerable Endpoints | Tabular Block over URLs |
| Severities | Active Findings by Severity chart Block |
Two do not carry across, and the migration says so per template rather than converting them into something approximate:
- Executive Summary — the classic engine derived this from whichever Findings widgets sat in the same report. There is no equivalent aggregate Block; rebuild it as a Text Block if you need it.
- Report Options — not a Block. Its Report name becomes the new Template’s name. Finding notes, finding images and per-widget page breaks are Theme-level settings in the new engine.
What happens to reports you have already run
Nothing. Generated Reports produced by the classic engine are finished files, so there is nothing to convert. They stay listed and downloadable until the engine is removed — save anything you want to keep beyond 3.3.0.
If the Report Builder is switched off
Migration still works with the Reporting feature flag disabled. The converted Templates simply do not appear until the flag is switched back on, so you can move your templates across on your own schedule.
Next steps
- Report Builder API — script the whole workflow (Themes, Blocks, Templates, and Generated Reports) for repeatable, automated reporting.
- Report Builder with an LLM — use LLM-assisted authoring to design and build reports conversationally.