

DefectDojo Main Dashboard (Open Source)
The Dashboard is likely the first page you’ll see when you open DefectDojo. It summarizes your team’s performance, and provides tracking tools to monitor specific areas of your vulnerability tracking environment.
💡 DefectDojo Pro: In DefectDojo Pro, the home page is a fully customizable dashboard — you build it from widgets and arrange them yourself, rather than using the fixed layout described below. See Customizable Dashboards for the concepts and a UI walkthrough. The rest of this page describes the open-source Main Dashboard.
Dashboard Components
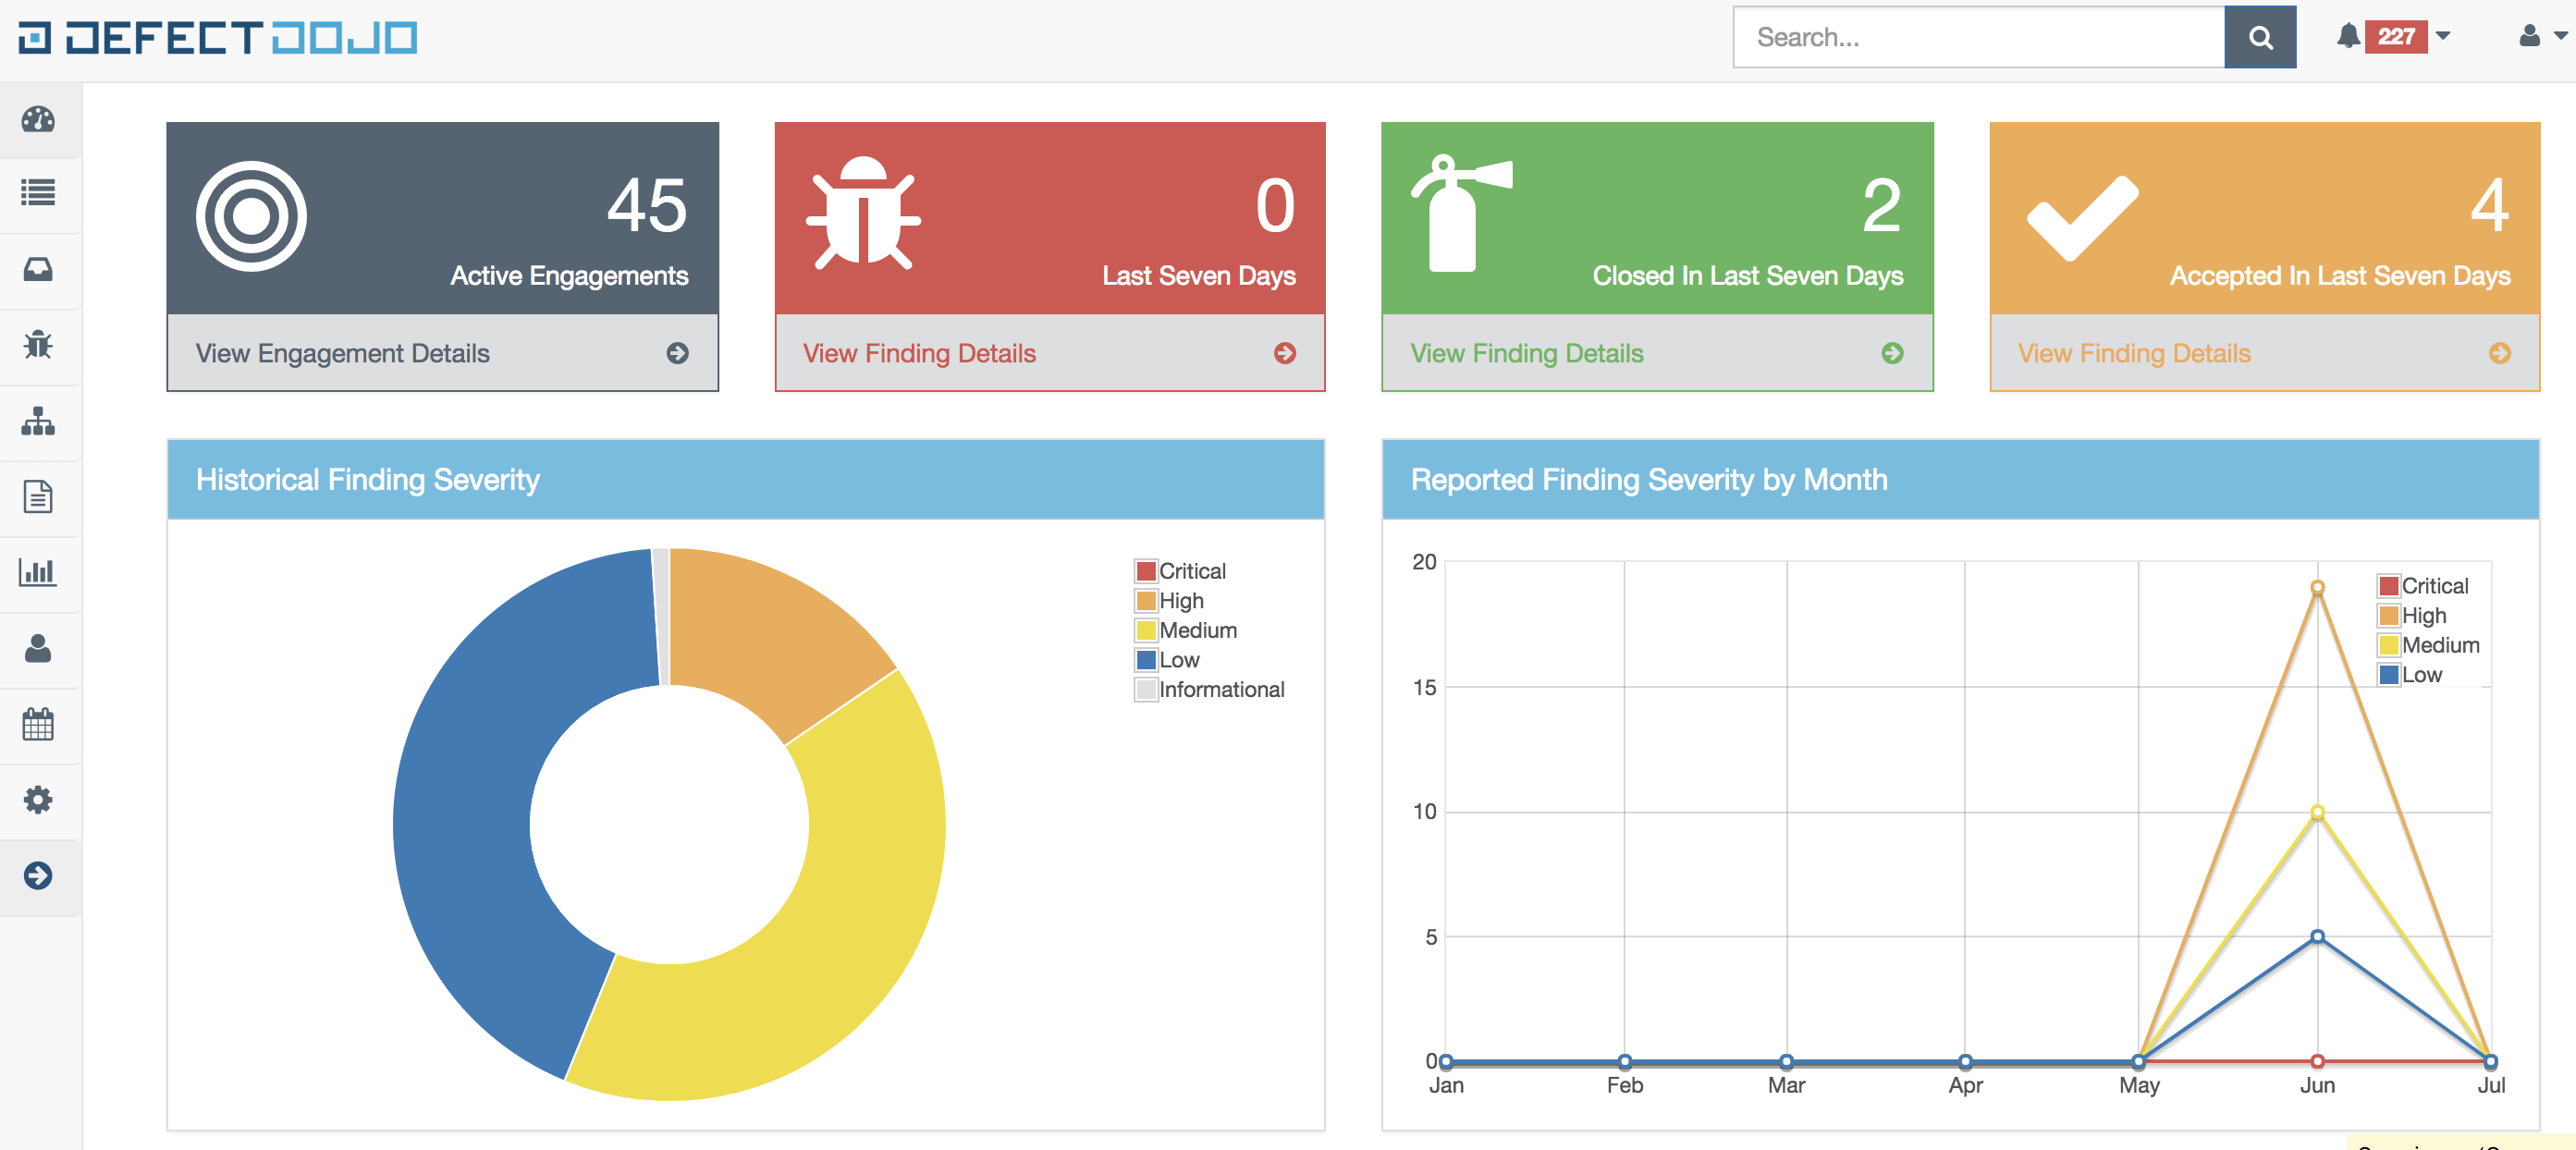
The open-source dashboard provides a high-level snapshot of your security posture with the following built-in components:
Summary Cards
The top row of the dashboard displays four summary cards that give you an at-a-glance view of activity:
- Active Engagements — total number of currently open Engagements across all Assets.
- Findings Last 7 Days — new Findings created in the past week.
- Closed in Last 7 Days — Findings that were resolved recently.
- Accepted in Last 7 Days — Findings that were risk-accepted recently.
Each card links directly to the relevant filtered list so you can drill in with one click.
Historical Finding Severity
This pie chart breaks down all Findings ever created in DefectDojo by Severity (Critical, High, Medium, Low, Informational), giving you a quick read on the overall distribution of vulnerabilities in your environment.
Reported Finding Severity by Month
This line chart plots the volume and severity of incoming Findings month-over-month, helping you spot trends such as spikes after a new scanner integration or sustained improvement from remediation efforts.
Dashboard Configuration
Superusers can toggle which charts appear on the dashboard. Navigate to the gear menu in the top-right corner and select Edit Dashboard Configuration to show or hide:
- Display Graphs — controls the Historical Finding Severity and Reported Finding Severity charts.
- Display Surveys — controls the Unassigned Answered Engagement Questionnaires table.
- Display Data Tables — controls the Top 10 / Bottom 10 Graded Assets tables.
Select Reset Dashboard Configuration from the same menu to restore defaults.