

Customizable Dashboards (Pro)
Note: Customizable Dashboards (layouts, widgets, and the widget catalog) are a DefectDojo Pro feature. They are off by default — a superuser can turn them on from Settings > Feature Flags on both Cloud and On-Premise instances.
DefectDojo Pro Customizable Dashboards let each user assemble their own dashboards out of widgets (counts, charts, leaderboards, feeds, and notes) arranged on a drag-and-drop grid. Instead of a single fixed dashboard for everyone, you build the layouts that matter to you: an executive overview, a triage queue, a remediation-velocity board, a scanner-effectiveness view. You can keep layouts private, publish them to your whole team, set one as the default that opens on the Dashboards page, and clone any layout (yours or a shared template) as a starting point. The home page itself is the Command Center, which every user has and which links to these grids.
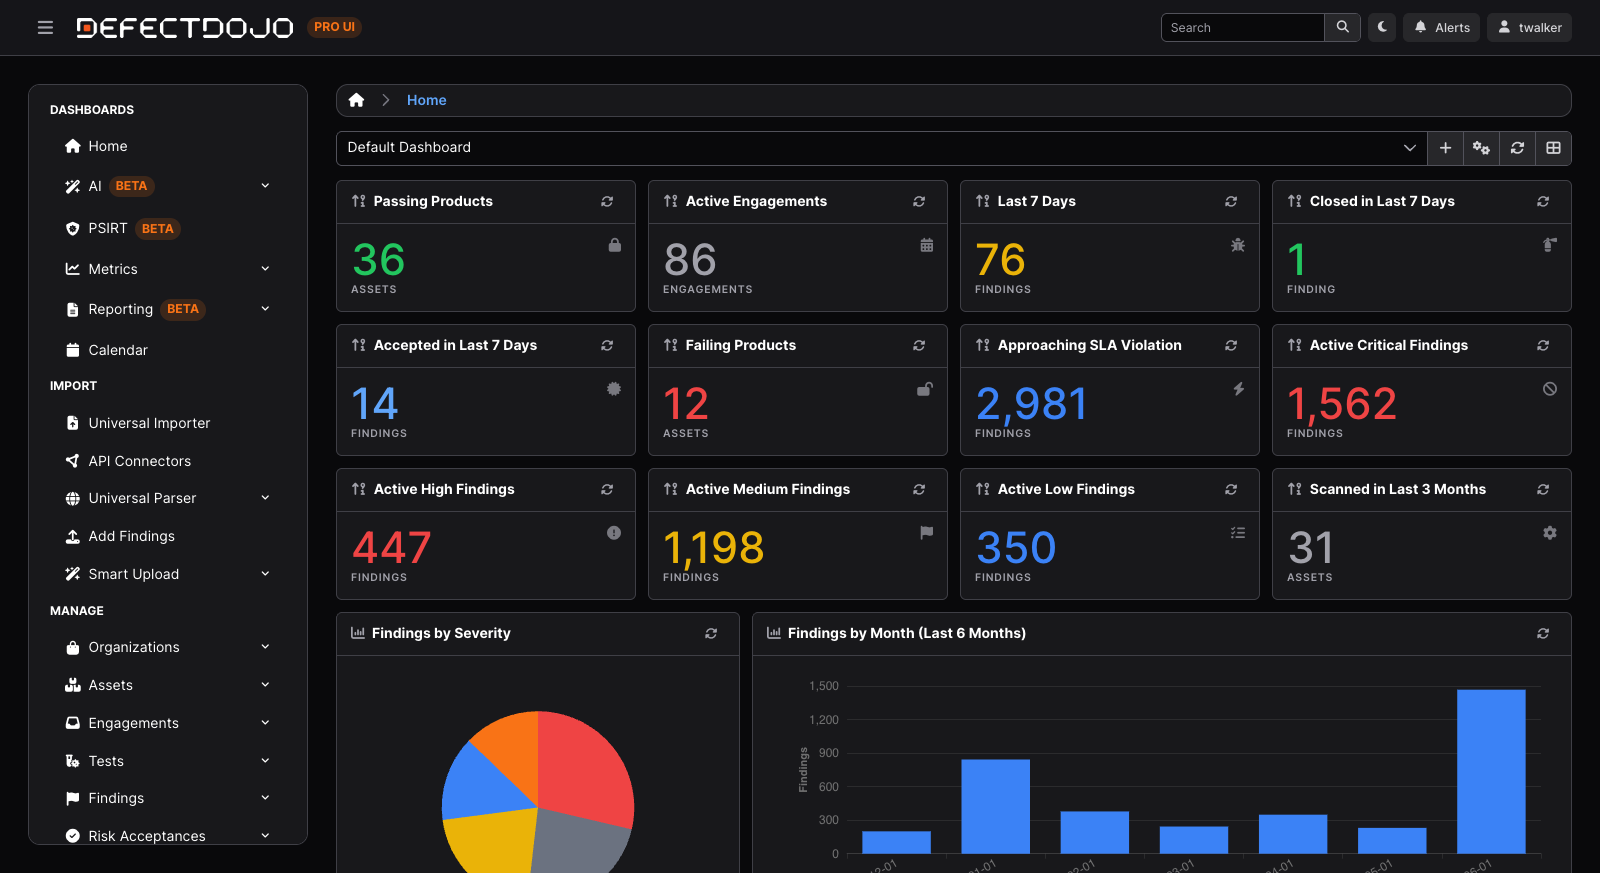
How it compares to open source
Open source DefectDojo has a single, built-in Main Dashboard with a fixed set of summary cards and charts that a superuser can show or hide. It is the same for every user.
DefectDojo Pro’s home page is the Command Center, and beside it Customizable Dashboards give each user per-user customizable dashboards. You choose which widgets appear, how they are filtered, and where they sit on the grid. You can build any number of named layouts, switch between them, share them with your team, and drive the whole system from the REST API or an LLM.
💡 Tip: In DefectDojo Pro, Assets were formerly called Products and Organizations were formerly Product Types. The UI uses the new wording, but some underlying widget settings still use the legacy names — for example, most widgets take a
modeloffinding,product,engagement, ortest. Where this matters, it is called out below.
Enabling Customizable Dashboards
Customizable Dashboards are off by default. A superuser can turn them on from Settings > Feature Flags, on both Cloud and On-Premise instances. See Feature Flags.
Once it is enabled, Dashboards appears in the sidebar under Home (the Command Center), opens your customizable dashboards, and the Dashboards REST API becomes available.
🔑 Important: While the feature is off, that sidebar entry reads Dashboard and opens the classic tile dashboard instead, and every
/api/v2/dashboards/endpoint other than the Command Center’s own returns403 Dashboards 2.0 is not enabled.Home is the Command Center either way. Turning it on does not change anyone’s data access: every widget still respects DefectDojo’s role-based access control, so each user only ever sees the Findings, Assets, and other records they are authorized to view.
Core concepts
A customizable dashboard is built from a few simple pieces.
Layouts
A layout is one named dashboard: a collection of widgets and their positions on the grid. Each layout belongs to you, and you can have as many as you like — for example a “Daily Triage” board and a separate “Exec Overview.” A layout stores three things:
- widgets — the ordered list of widgets it contains, each with its own type, title, and configuration.
- layout — where each widget sits and how big it is on the grid.
- settings — layout-level display options.
The first time you open Customizable Dashboards, DefectDojo gives you a personal copy of the Default Dashboard starter so you are never staring at a blank page.
Widgets
A widget is a single panel on the dashboard. Every widget is an instance of a type from the catalog (a Count, a Graph, a Top-N leaderboard, and so on), and carries its own configuration: which data model it reads (finding, product, engagement, or test), what filters scope it, and type-specific display options like chart type, colors, or grouping. Two widgets of the same type with different filters are completely independent.
Each widget also has an optional auto-refresh interval (off, 30 seconds, 1 minute, 5 minutes, or 15 minutes) and an editable title.
The widget catalog
The catalog is the fixed menu of widget types the platform supports, grouped into four categories — Numbers, Charts, Lists & Feeds, and Static & Utility. When you add a widget, you pick its type from the catalog. The catalog is also available over the API so scripts and LLMs can discover the available widget types and a known-good starting configuration for each. See The widget catalog below for the full list.
The grid
Widgets are placed on a 12-column grid. In edit mode you drag widgets to move them and drag the bottom-right corner to resize them; the grid compacts upward to fill gaps. Each widget type has sensible minimum and maximum sizes so charts and tables stay legible.
Sharing, cloning, and defaults
- Default — one of your layouts is your default: the one that loads when you open the Dashboards page. You can change which layout is your default at any time.
- Clone — copy any layout (one of yours, or a shared template) into your own space as a fresh, independent starting point. Cloning gives the copy its own widgets, so editing the clone never touches the original.
- Share — publish one of your layouts to the whole team as a shared layout. Other users can see it and clone it, but only a team Maintainer can publish, edit, or unshare a shared layout (unless it is collaborative, below). Sharing a layout shares only its design — every viewer still sees only the data their own permissions allow.
- Collaborative — a Maintainer can mark a shared layout as collaborative from Manage Layouts (Make Collaborative, reversed with Stop Collaborating). A collaborative layout is one live dashboard rather than a template to copy: it appears in every user’s layout picker, anyone can set it as their default, and anyone can add, remove, rearrange, or configure its widgets. Every change is saved to the same layout, so everyone using it sees it. Renaming, unsharing, deleting, and the collaborative setting itself stay with a Maintainer. If a layout stops being collaborative (or is unshared), users who had it as their default fall back to their own layouts. Edits are saved as they are made, so two people editing at the same moment can overwrite each other’s change; the layout re-syncs from the server when you enter edit mode.
- Starter & shared templates — DefectDojo ships a set of curated shared templates you can clone as a head start (see Shared templates below). The Default Dashboard is the special “starter” template that new users are given automatically.
- Global default: a user who can share dashboards can mark a shared layout as the global default from Manage Layouts (Set as Global Default, cleared with Clear Global Default). It carries a “Global Default” badge, and it is the dashboard everyone is shown when dashboard customization is restricted (see below). It can also be chosen from a dropdown on the Layout Defaults settings page (Settings, then UI Defaults, then Layout Defaults).
Restricting customization
An administrator can enable Restrict Layout Customization (Settings, then UI Defaults, then Layout Defaults) to limit dashboard changes to superusers. Everyone else is shown the global default dashboard, or the built-in starter dashboard when none is designated, with no toolbar options to create, switch, edit, or manage layouts. Personal dashboards saved earlier are kept and reappear if the setting is turned back off.
Building a dashboard in the UI
The dashboard toolbar
The toolbar across the top of the Dashboards page is where you switch layouts and manage them. It includes a layout picker (with badges that mark your default layout, any shared layouts/templates, and collaborative layouts shared with you), and buttons to create a New Layout, open Manage Layouts, Refresh all widgets, and toggle Edit mode.
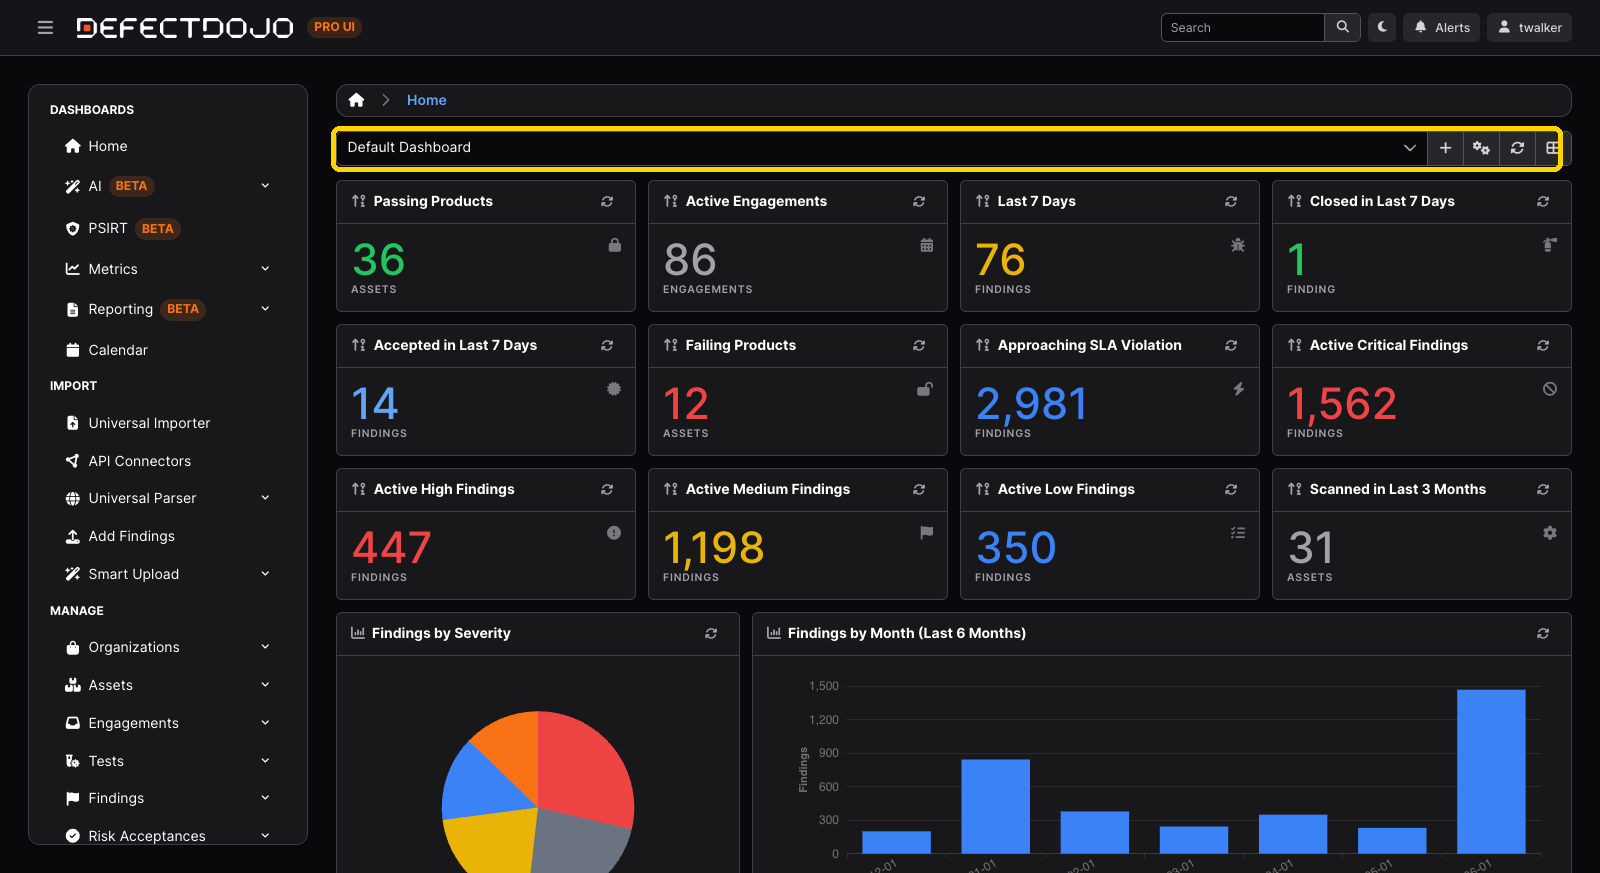
Step 1: Enter edit mode
Click Edit to unlock the dashboard. The grid becomes draggable and resizable, and an Add Widget button appears. Click Done when you are finished — edit mode also turns off automatically when you switch layouts.
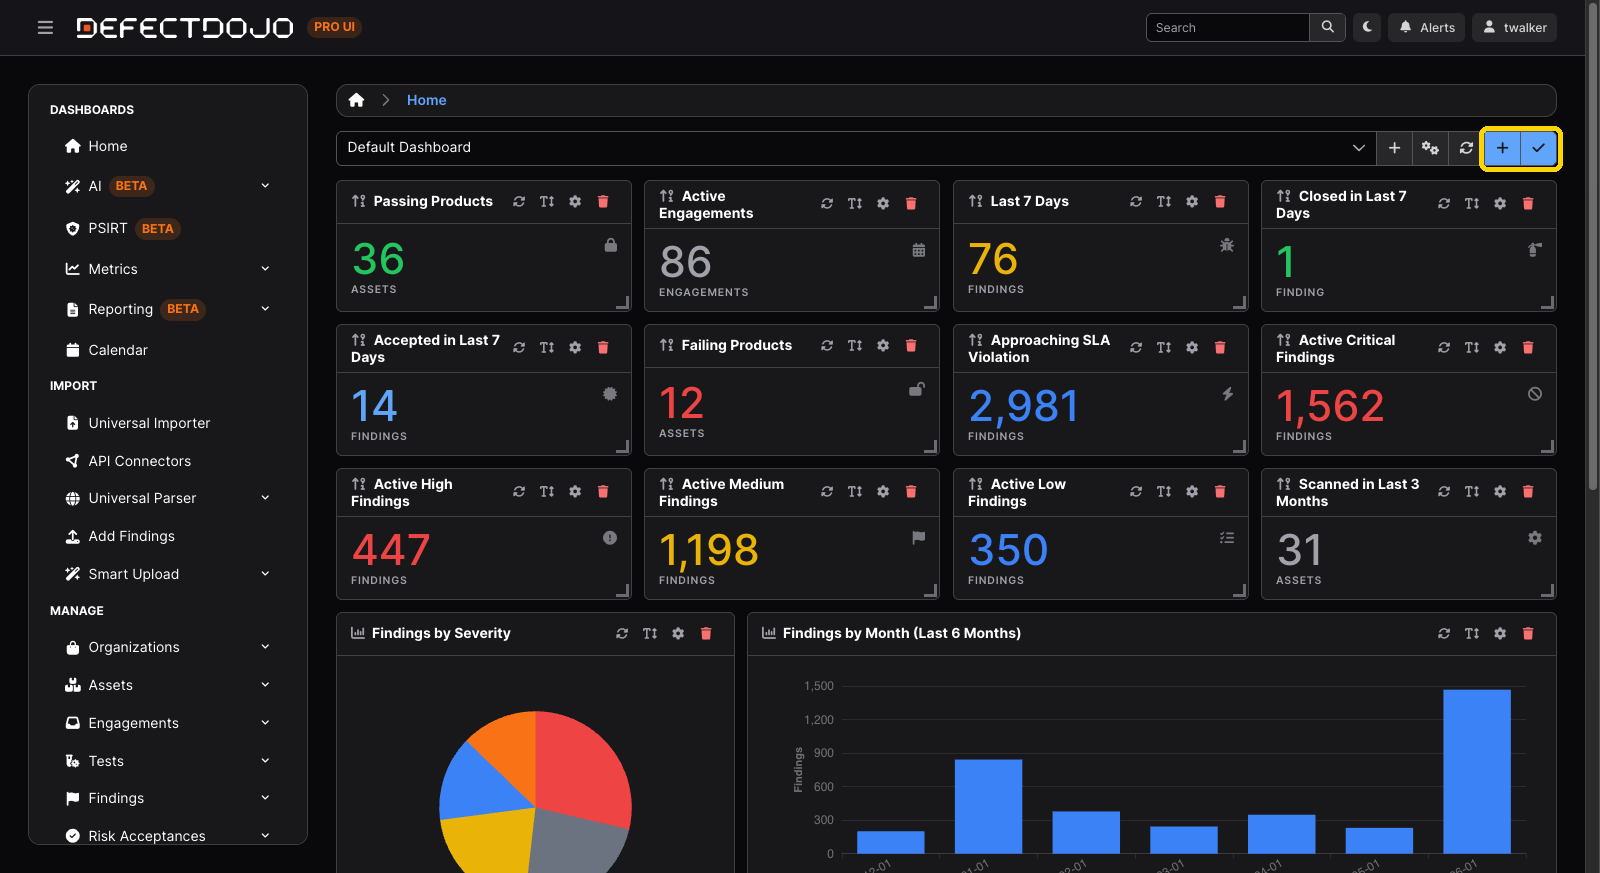
Step 2: Add a widget
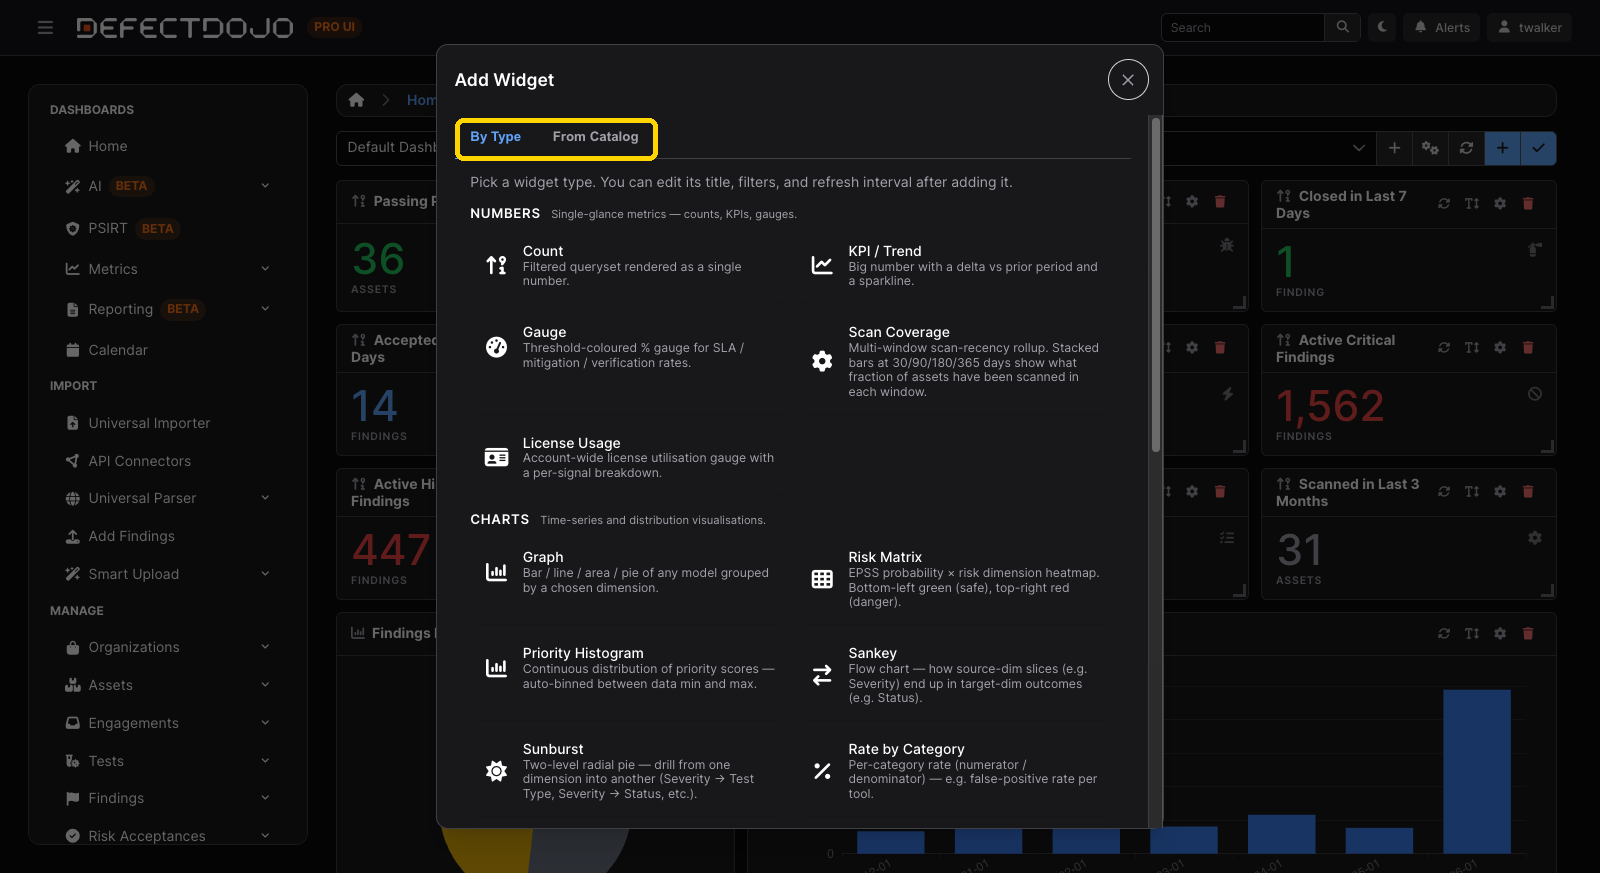
In edit mode, click Add Widget to open the picker. It has three tabs:
- By Type: browse the catalog by category (Numbers, Charts, Lists & Feeds, Static & Utility). Each card shows the widget’s name and a short description. Picking one adds it to the grid and opens its configuration dialog.
- From Catalog: start from a pre-configured widget taken from one of the shared templates (for example, the “Findings by Severity” chart from the Default Dashboard). These come ready-configured, so they drop straight onto the grid.
- From Reports: start from a Chart or Widget block someone already built in the Report Builder. The widget lands configured the way that block is. This tab appears when Reporting is enabled and you can view report templates.
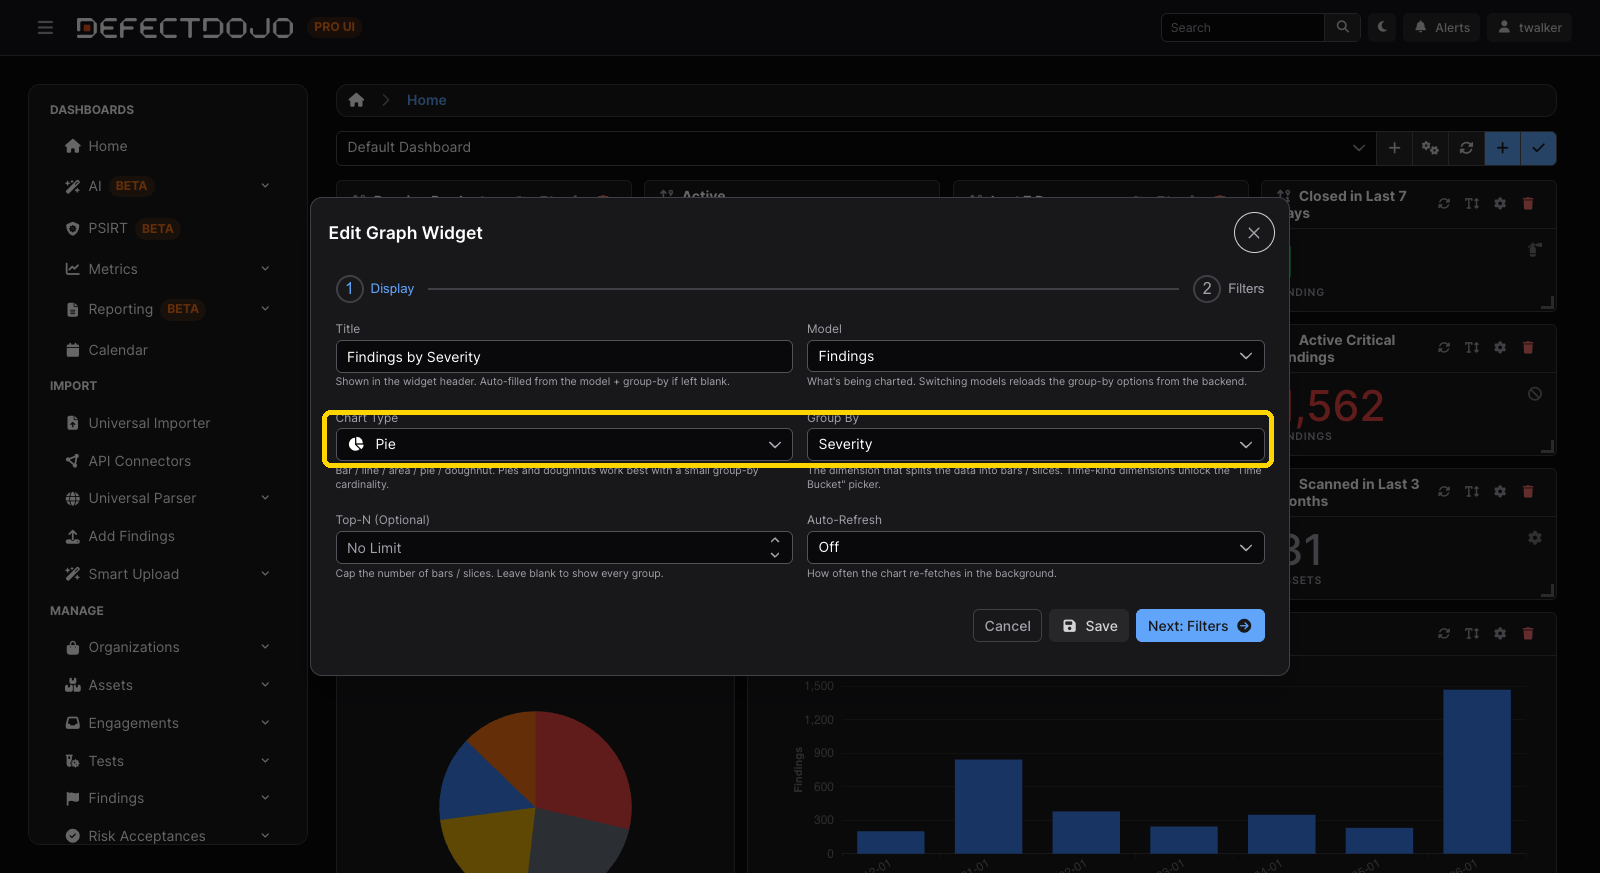
Step 3: Configure the widget
Each widget opens a configuration dialog tailored to its type. Common settings include:
- Title — the heading shown on the widget.
- Model — which records the widget reads (Finding, Asset, Engagement, or Test), where applicable.
- Filters — an embedded list-view filter UI that scopes the widget to exactly the records you want (for example, active Critical findings). The filters you pick here are the same ones you would use on that object’s list page.
- Refresh interval — how often the widget reloads on its own.
- Type-specific options — for example chart type and group-by dimension for a Graph, thresholds for a Gauge, or the metric for a Top-N leaderboard.
💡 Tip: A widget’s data always respects your permissions. If a shared layout includes a “My Work” widget, every viewer sees their own assignments and mentions — not the layout author’s.
Step 4: Arrange, then save
Drag widgets to rearrange them and drag a corner to resize. Use the gear icon on a widget to reconfigure it, the duplicate icon to copy it, and the trash icon to remove it. Position and size changes are saved automatically as you go. Click Done to leave edit mode.
Duplicating a tile is the fastest way to build a row of related tiles: the copy keeps the original’s type, filters, size, title style, and refresh cadence, lands in the next free space on the grid, and gets a (Copy) suffix on its title. Open its gear icon to rename it and change the one filter that differs.
A Section Break is the exception: its header already labels it, so a copy keeps the original’s title as it is, with no (Copy) suffix. A Section Break’s title is optional. Clear the Title field in its gear icon to leave the widget’s title bar blank.
Putting a widget into a report
Customizable Dashboards and the Report Builder share one widget catalog, so a figure your team reads on a dashboard can go straight into a document you send out.
Click the export icon on a widget and choose Add to Report. Name the block, optionally pick a report Template to append it to, and it is created carrying the widget’s current filters. The action appears on widgets a report can draw, when Reporting is enabled and you have permission to add report templates.
This copies the widget rather than linking to it. Editing the dashboard widget later does not change the report block, and the reverse is also true, so a shared dashboard never depends on who can see which report block.
Managing layouts
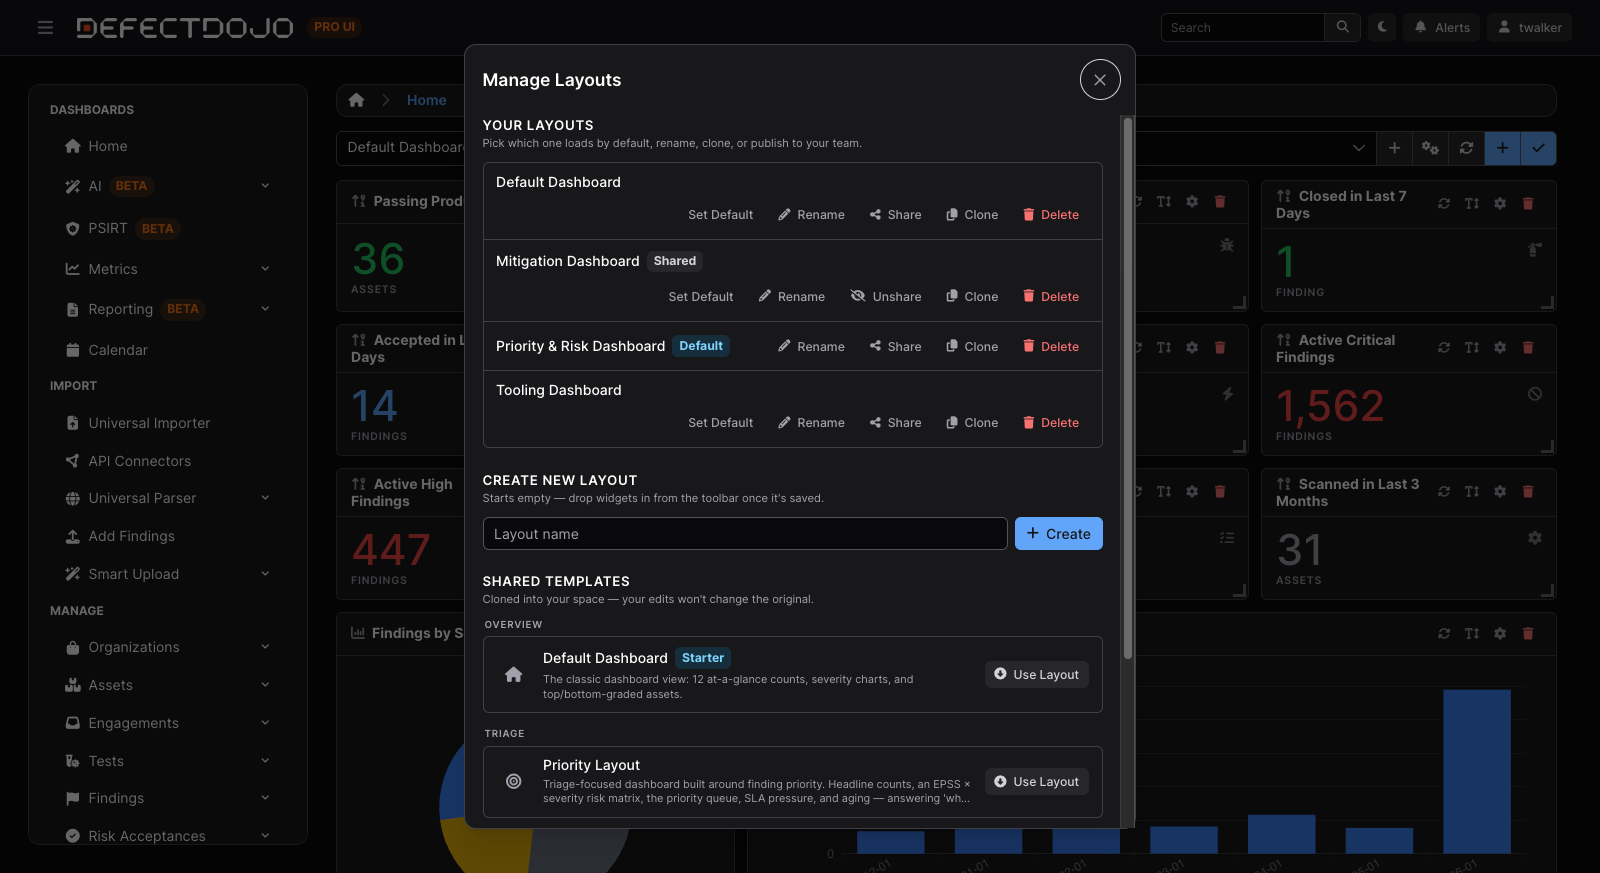
The Manage Layouts dialog (the gear button on the toolbar) is the hub for everything layout-level:
- Your Layouts — rename, set as default, share/unshare, clone, or delete each layout you own. Collaborative layouts shared with you are listed here too, tagged Collaborative, and can be set as your default or copied into a layout of your own; a Maintainer also sees Make Collaborative / Stop Collaborating on shared layouts.
- Create New — start a fresh, empty layout to build from scratch.
- Shared Templates — browse curated and team-published layouts grouped by category, and click Use Layout to clone one into your own space.
Shared templates
DefectDojo ships four ready-to-use shared templates you can clone as a starting point:
| Template | Purpose |
|---|---|
| Default Dashboard | The classic home view — 12 at-a-glance counts, severity charts, and top/bottom-graded assets. This is the starter every new user receives automatically. |
| Priority Layout | A triage-focused board built around finding priority and risk. |
| Mitigation Layout | A remediation-velocity board (closure trends, MTTR/MTTD, aging). |
| Tool Layout | A scanner-effectiveness board built around test types and recent scan activity. |
💡 Tip: Cloning a template makes an independent copy. Customize the clone freely — you will not affect the template or anyone else who clones it. A collaborative layout is the exception by design: it is used live rather than copied, so edits made to it are visible to everyone. Take your own copy of a collaborative layout only when you want a private version that no longer follows the shared one.
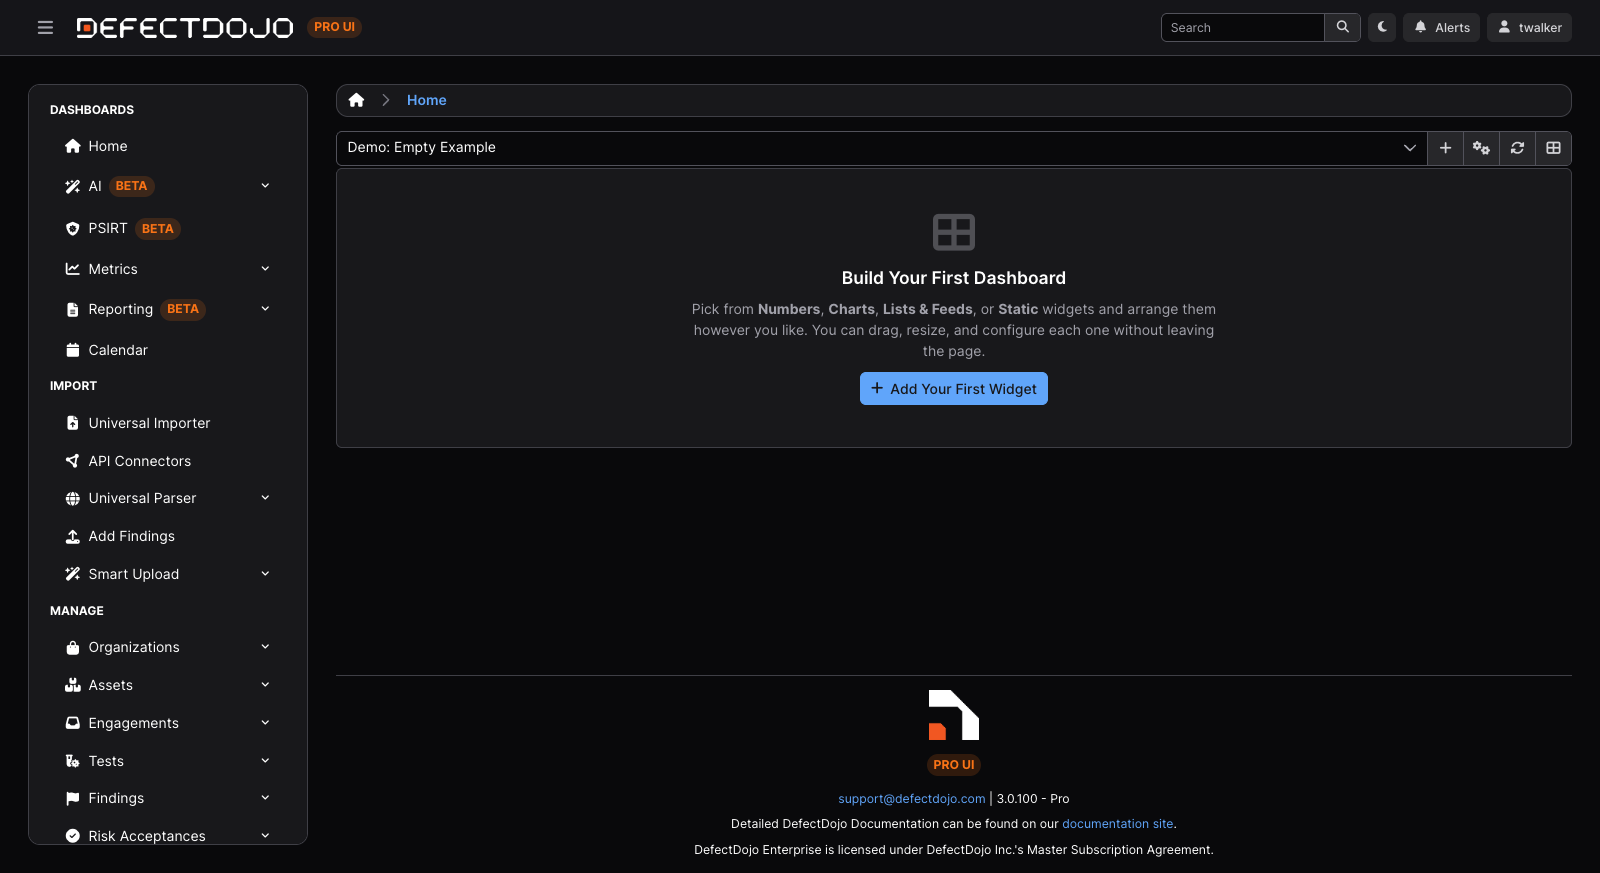
The empty state
A brand-new layout with no widgets shows a “Build Your First Dashboard” prompt. Click Add Your First Widget to jump straight into edit mode and start choosing widgets.
The widget catalog
Customizable Dashboards ship with the following widget types, organized into four categories. Most widgets read one of four models — finding, product (Assets), engagement, or test — and are scoped by filters you choose. The fully detailed configuration options for each widget are documented in the API guide.
Numbers
Single-glance metrics — counts, KPIs, and gauges.
| Widget | What it shows |
|---|---|
| Count | A single number from a filtered query — e.g. “Open Critical Findings” or “Active Engagements.” Works with finding / asset / engagement / test. |
| KPI / Trend | A headline number plus its change versus the prior period, with an optional sparkline. |
| Gauge | A ratio drawn as an arc gauge — a “universe” filter as the denominator and a “pass” filter as the numerator. Use for SLA compliance, mitigation rate, or scan coverage, with configurable warning/OK thresholds. |
| License Usage | Your account’s license-usage status with a per-signal breakdown (database size, weekly finding volume, and so on). Requires the Maintainer role. |
| Scan Coverage | What fraction of assets were scanned within 30 / 90 / 180 / 365 days, as a multi-window rollup. |
Charts
Time-series and distribution visualizations.
| Widget | What it shows |
|---|---|
| Graph | A general-purpose chart over any model and group-by dimension — bar, line, area, pie, or doughnut. E.g. Findings by Severity, Findings by Month. |
| Sankey | A flow diagram from a source dimension to a target dimension — e.g. Severity → Status. |
| Sunburst | A one- or two-level radial breakdown — e.g. Severity, then Test Type within each severity. |
| Risk Matrix | An EPSS-probability × risk heatmap of findings — bottom-left safe, top-right dangerous. |
| Priority Histogram | The distribution of finding priority scores from the prioritization engine, auto-binned. |
| Rate by Category | A per-category ratio (numerator / denominator) — e.g. False-Positive Rate by Tool or Mitigation Rate by Asset. |
| Finding Velocity | Findings created versus closed over time, showing whether the backlog is growing or shrinking. |
| MTTR / MTTD | Mean Time to Remediate and Mean Time to Detect, as paired time-series. |
| Vulnerability Aging | Open findings bucketed by age band (0–30d / 30–90d / 90–180d / 180d+), stacked by severity. |
| Activity Heatmap | A GitHub-style calendar of daily activity over a rolling window. |
| Portfolio Treemap | Nested rectangles for a portfolio rollup (Organization → Asset), sized by count and tinted by severity. |
Lists & Feeds
Ranked lists, feeds, and embedded tables.
| Widget | What it shows |
|---|---|
| Top-N Leaderboard | A ranked list in one of two modes: aggregate (top dimension buckets by count, e.g. Top 10 CWEs) or records (top individual records by a metric, e.g. Top 10 Assets by Grade). |
| Embedded Table | A full list view (Findings, Assets, Engagements, Tests, Risk Acceptances, Organizations, or Test Types) with preset filters and ordering — pagination, sorting, and CSV export included. |
| Recent Activity | A scrolling feed of the most-recently updated records, clickable through to detail pages. |
| SLA Burndown | Findings approaching SLA breach, ranked by days remaining, with countdown badges. |
| My Work | Your personal queue — assignments, mentions, and pending risk-acceptance reviews. Always scoped to the viewer. |
| Saved Reports | One-click access to your saved Report Templates. Requires the Reporting feature. |
| Top Root Causes | The highest-ranked Root Cause clusters, with the number of Findings each groups, the Assets affected, and their priority and risk band. Requires the Root Cause Correlation feature. |
Static & Utility
Notes, shortcuts, and structure.
| Widget | What it shows |
|---|---|
| Favorites | User-curated quick links to specific pages in the app. |
| Section Break | A labeled divider for grouping related widgets under a heading. |
| Markdown / Notes | An inline rich-text panel for headers, context notes, or reference links. |
| Quick Actions | One-click action buttons that navigate to a chosen page. |
Next steps
- Automating Dashboards with the API — discover the widget catalog, create and update layouts, and render widget data over the REST API, with a complete script.
- Building Dashboards with an LLM — let an LLM design and build dashboards for you (the dashboards API was built with AI agents in mind).
- MCP Server — Dashboards Toolset — connect an AI assistant to the MCP Server with
?toolsets=dashboardsto summarise, diagnose, build and share dashboards from the chat, with no script.