DefectDojo Main Dashboard
The Dashboard is likely the first page you’ll see when you open DefectDojo. It summarizes your team’s performance, and provides tracking tools to monitor specific areas of your vulnerability tracking environment.
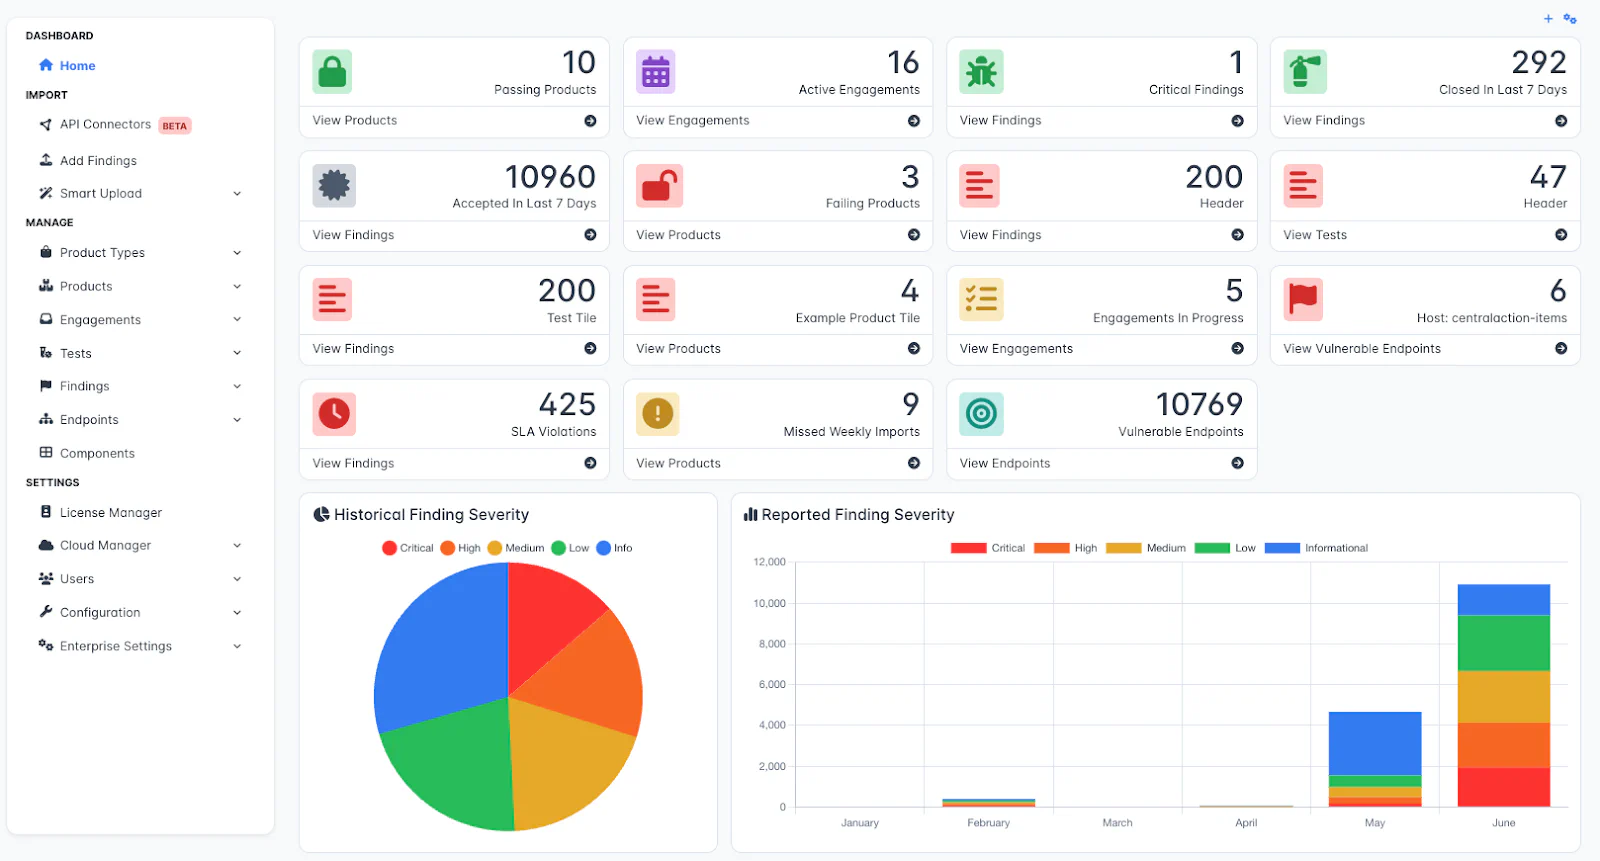
Dashboard Components
- Customizable Dashboard Tiles, which you can use to visualize the metrics which are relevant to you.
- Pre-built Dashboard Charts, which visualize your team’s overall performance.
Each team member shares a single dashboard, but the results of the dashboard are restricted by their role and Product Membership. Team members will only see calculated stats for the Products, Engagements, Findings or other objects that they have access to. For more information, see our guides on User Permissions and Roles.
Dashboard Tiles
Tiles are designed to provide relevant information and speed up navigation within DefectDojo.

Tiles can:
- Act as shortcuts for particular sets of Findings, Products, or other objects
- Visualize metrics related to your Product
- Provide alerts on particular activity, track SLA Violations, failing imports or new Critical Findings
Tiles are pinned to the top section of your 🏠 Home page.
To learn how to add and use dashboard tiles, see our guide.
Dashboard Charts
Located beneath Dashboard Tiles, DefectDojo has five pre-built charts:
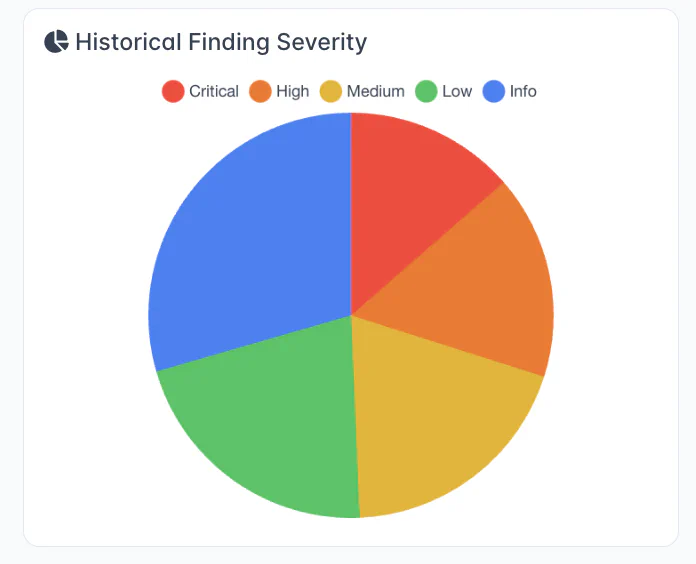
- Historical Finding Severity pie-chart
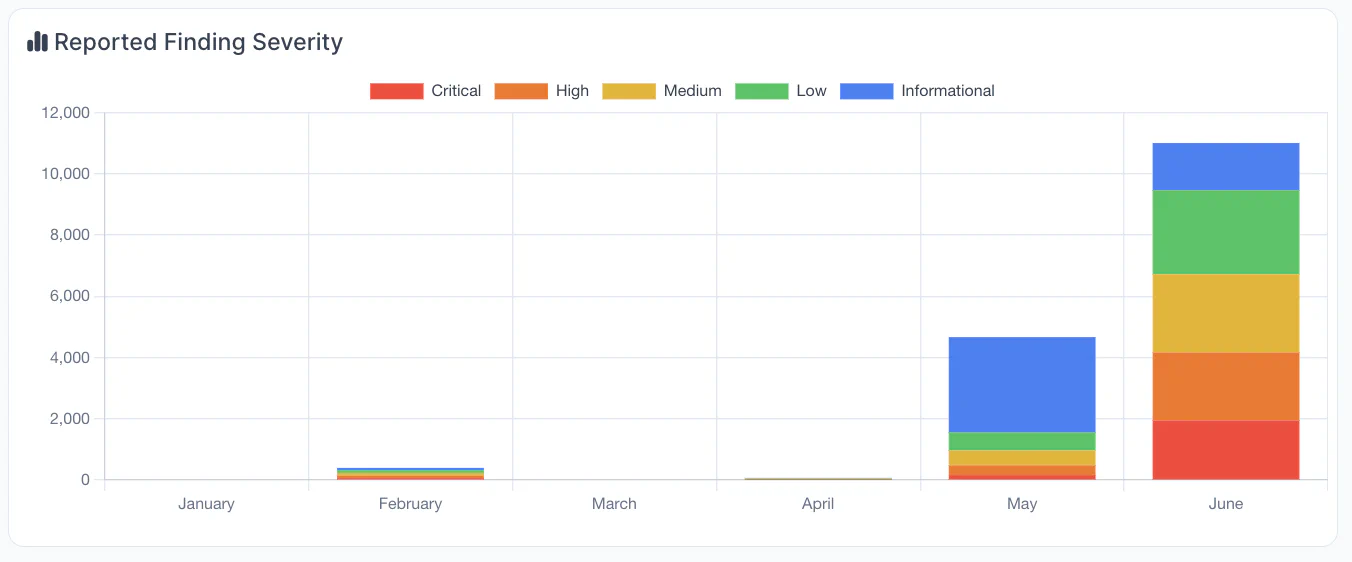
- Reported Finding Severity histogram, by month
- Unassigned Answered Engagement Questionnaires table
- Top 10 Graded Products table
- Bottom 10 Graded Products table
These charts can be added or removed from the dashboard via Dashboard Configuration.
Historical Finding Severity
This chart organizes all Findings created in DefectDojo by Severity, so that you can see the overall distribution of vulnerability levels in your environment.
Reported Finding Severity
This chart allows you to monitor the volume and severity distribution of incoming Findings per month.
Unassigned Answered Engagement Questionnaires
If you have completed Engagement Questionnaires for review, those will be listed in this table.

Top 10 / Bottom 10 Graded Products
This section summarizes the Graded performance of each Product in your instance, counting the Highest and Lowest scoring Products.

Finding Counts of each severity are calculated by the tile, but note that Product Grade is only assigned based on Active Findings, so there may be Inactive Findings counted in this table which do not contribute to the Grade.
To understand how grades are calculated, see our guide to Product Health Grading.
Dashboard Configuration
Superusers can choose which Metrics Charts are displayed on the Dashboard. To do this, select the Edit Dashboard Configuration option from the top-right hand gear menu.
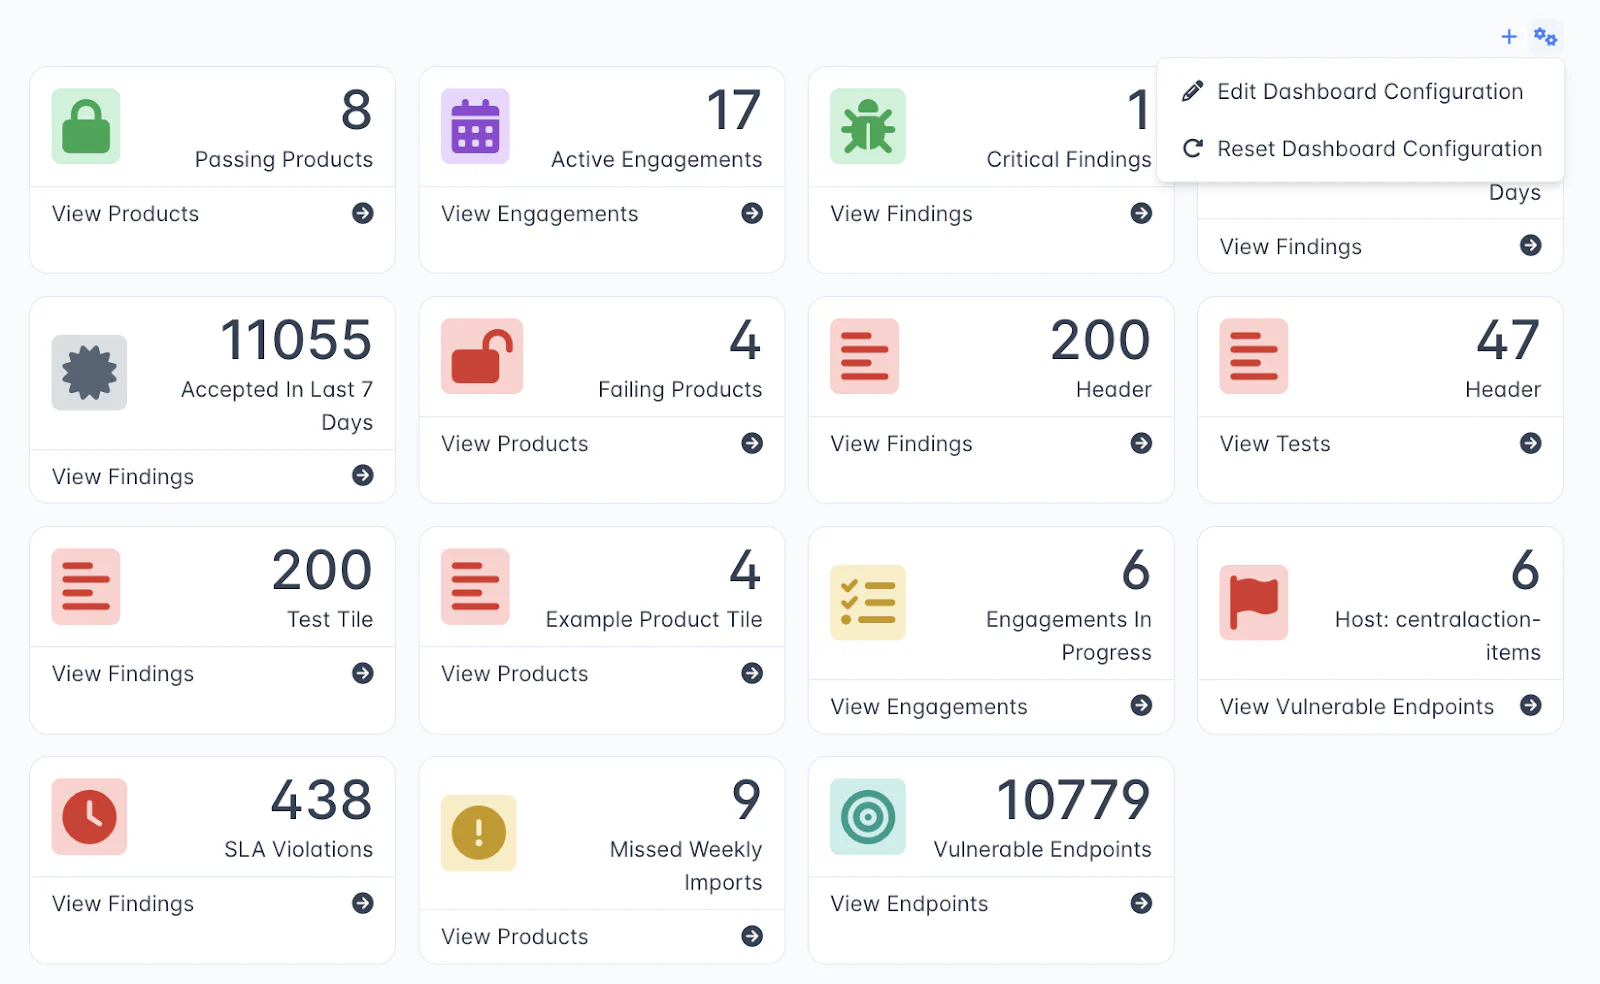 This will open the Dashboard Configuration Settings window.
Configuration Settings

- Display Graphs determines whether or not the Historical Finding Severity and Reported Finding Severity charts are visible.
- Display Surveys determines whether or not the Unassigned Answered Engagement Questionnaires table is visible.
- Display Data Tables determines whether or not the Top 10 / Bottom 10 Graded Products tables are visible.
Reset Dashboard Configuration
If you would like to reset your Dashboard to a default state, you can do so by selecting Reset Dashboard Configuration from the top-right hand gear menu.
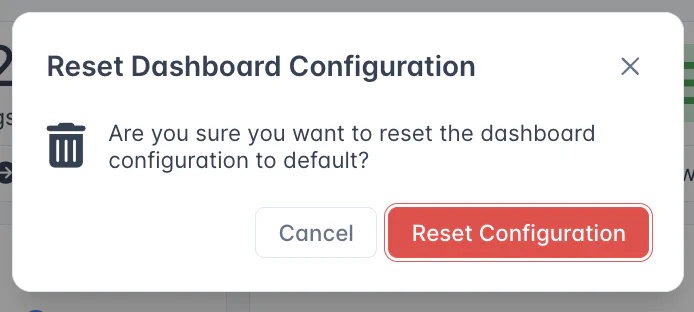
Note that this will remove any Custom Dashboard Tiles which have been added to your instance.
