

Diagnostics (Pro)
Diagnostics is a single ledger of every attempt DefectDojo makes to talk to something outside itself — and of the attempts other systems make to talk to it. When a ticket never appeared, a scan never imported, or a user could not sign in, this is the page that says what happened, when, to which configuration, and who set it off.
Diagnostics is a DefectDojo Pro feature. Find it under Connect > Diagnostics.
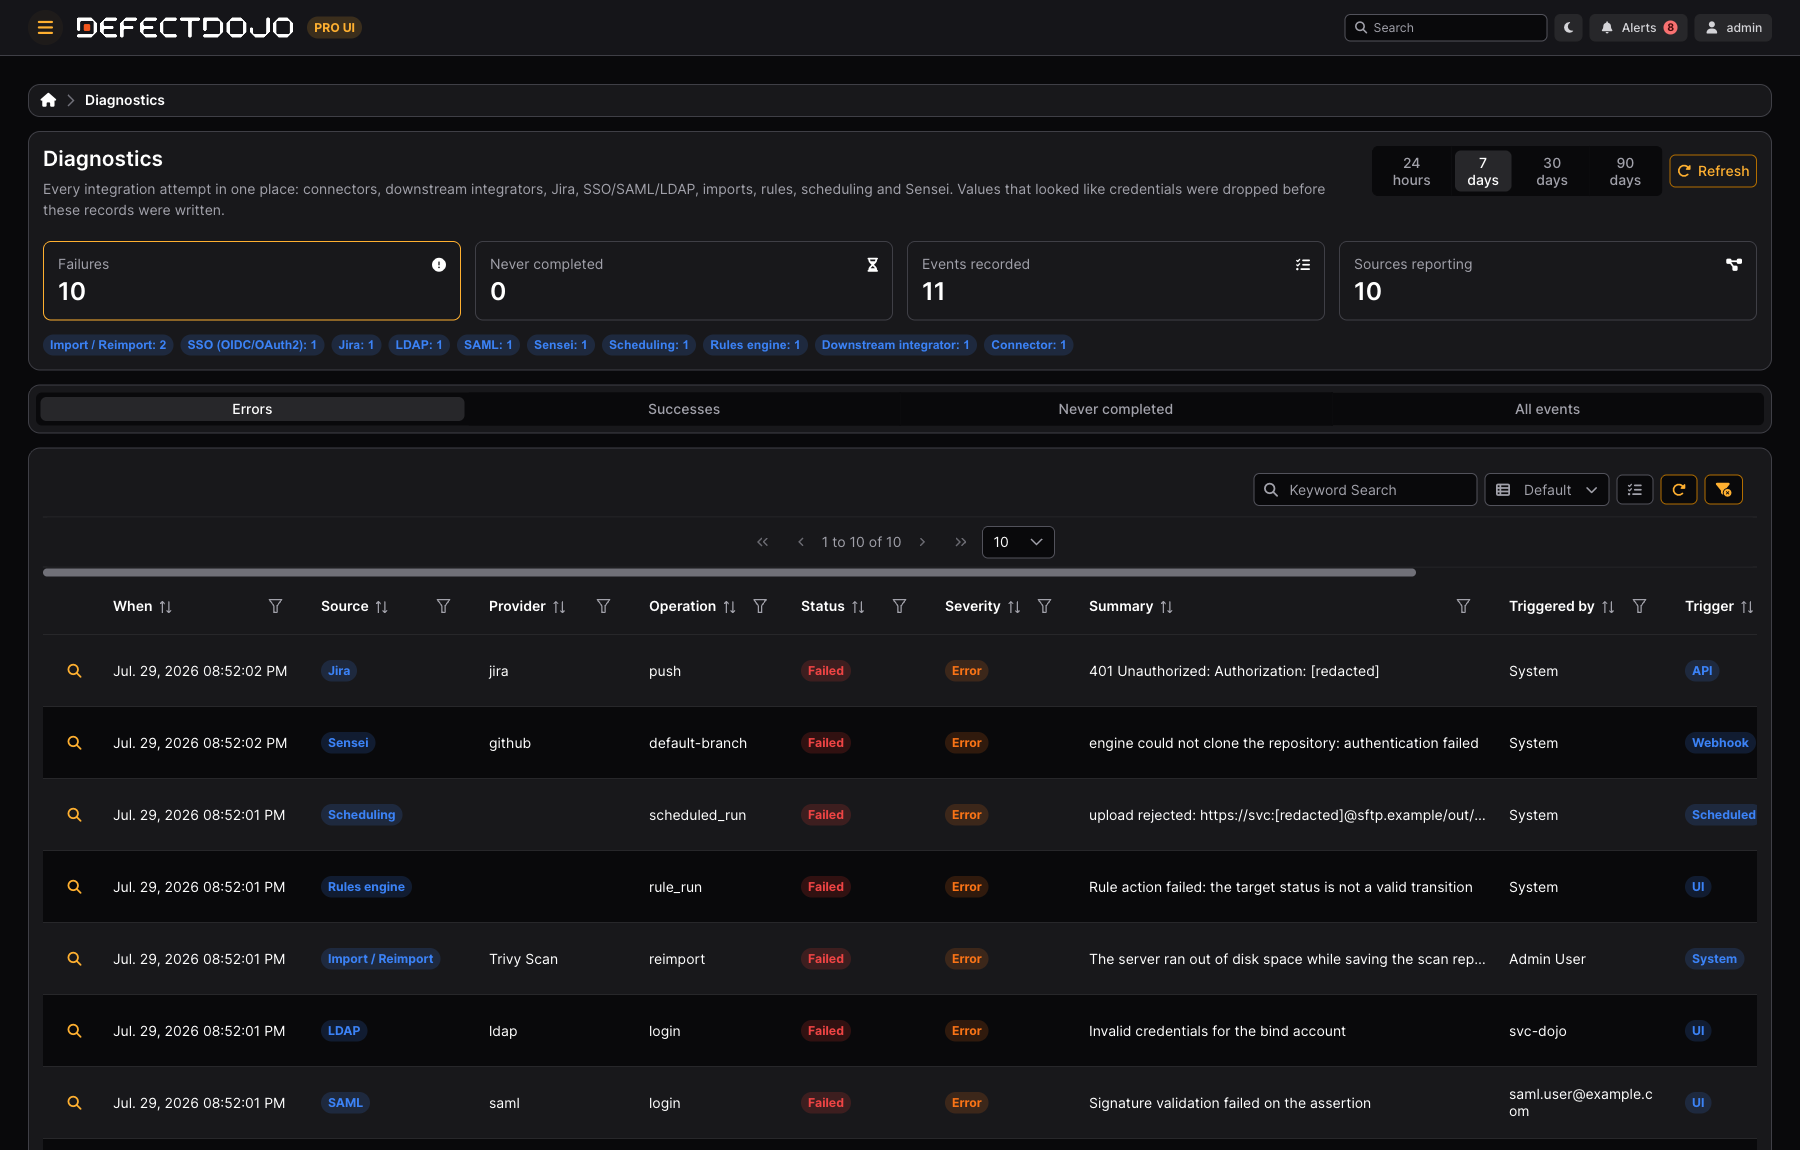
What is recorded
One row is written per attempt, from every subsystem that reaches outside DefectDojo:
| Source | What produces rows |
|---|---|
| Connector | Upstream connector discover and sync runs |
| Downstream integrator | Pushes to Jira, GitHub, GitLab, ServiceNow, and the other downstream connectors |
| Jira | The legacy Jira integration: pushes, comments, and previews |
| SSO (OIDC/OAuth2) | Sign-in attempts through an OAuth provider |
| SAML | SAML assertions, including signature and attribute failures |
| LDAP | LDAP binds and lookups |
| Import / Reimport | Scan uploads, whether by UI, API, or schedule |
| Rules engine | Rule evaluations and the actions they attempt |
| Scheduling | Scheduled runs, including ones that never started |
| Sensei | Repository scans and fix runs |
| Notification | Outbound notification delivery |
| System | Instance-level activity that belongs to no Asset |
Rows are written alongside the subsystem, never in place of it. Each adapter is attached to the origin record and is deliberately fail-safe: if writing a diagnostic row raises, the error is swallowed and the original operation carries on. Diagnostics can therefore never be the reason a push, import, or login fails.
Because rows are keyed on the record that produced them, re-saving an origin record updates its existing diagnostic row rather than adding a duplicate. One attempt is one row for its whole life, from Queued through Running to its outcome.
Fields on a row
| Field | Meaning |
|---|---|
| When | When the row was recorded; Started, Finished and Duration describe the attempt itself |
| Source | The subsystem, from the table above |
| Provider | The specific tool or provider within that source (jira, github, okta, a scanner name) |
| Operation | What was attempted (push, sync, login, reimport, rule_run) |
| Status | Queued, Running, Success, Failed, Timed out, Skipped, or Dry run |
| Severity | Info, Warning, Error, or Critical |
| Summary | A one-line outcome, safe to read at a glance |
| Trigger | What set the attempt off: UI, API, Scheduled, Webhook, Automatic, Command line, or System |
| Triggered by | The user responsible, or System for unattended work |
| Asset | The Asset the attempt belongs to; empty means instance-level |
| Related object | The finding, engagement, or other record the attempt was about |
| Configuration | Which configuration was used, by its label |
| External reference | The identifier the other system returned, such as a created issue key |
| Correlation ID | Ties together rows from one logical operation |
| Reported detail and Context | The full technical detail (restricted, see Who sees what) |
The four views
The tabs above the table are saved starting points, not filters you have to rebuild:
- Errors — failures and timeouts. The one to open first.
- Successes — proof that a working integration is working, useful when someone reports “nothing is syncing”.
- Never completed — attempts still
QueuedorRunningwell past when they should have finished. These are the silent ones: nothing failed, so nothing was reported, but nothing arrived either. - All events — everything, unfiltered.
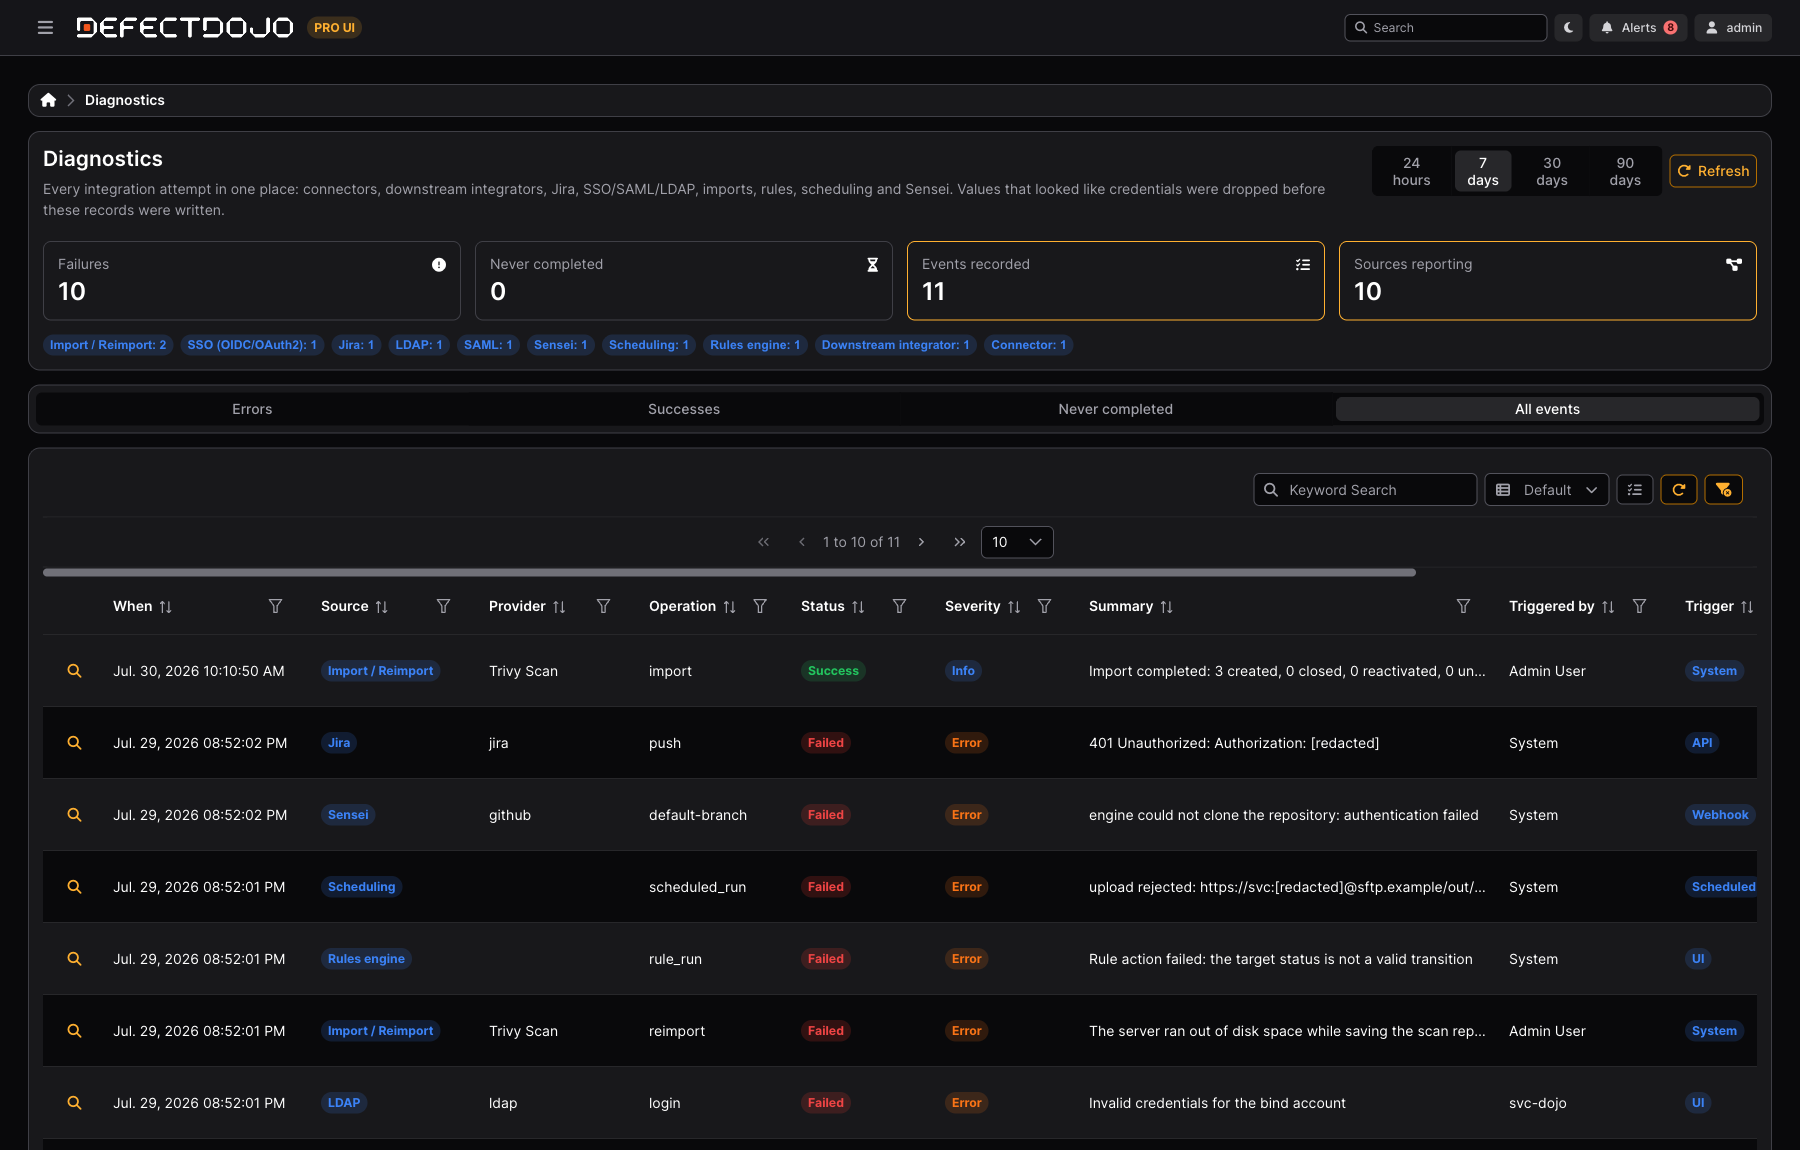
The active view is part of the page URL, so a view is linkable and survives a refresh.
Narrowing the list
- Time range — 24 hours, 7 days, 30 days, or 90 days, from the buttons in the header.
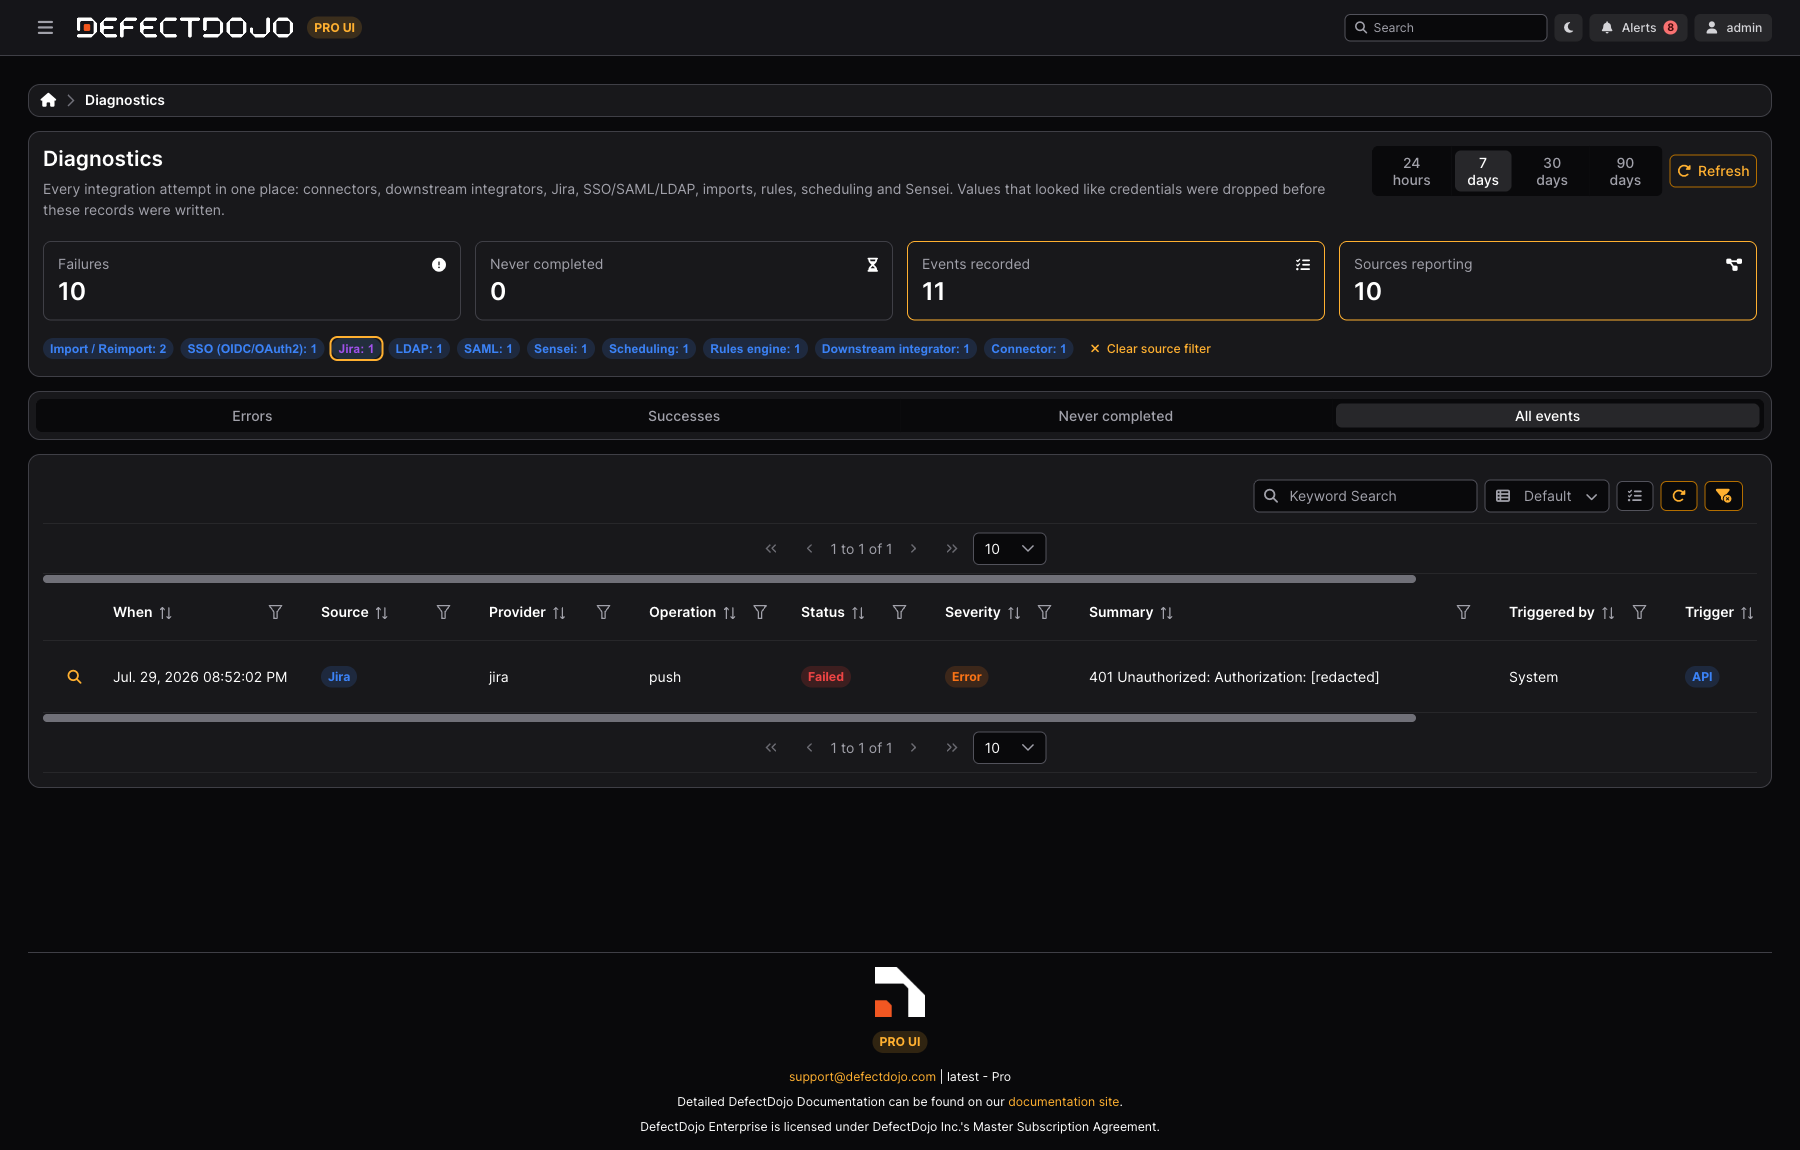
- Source counts — the coloured counts under the summary cards are also quick filters. Click one to show only that source; click it again (or Clear source filter) to go back. One or none is active at a time.
- Per-column filters and sorting — every column filters and sorts, including Severity and Source. Severity sorts by seriousness (
Critical→Info) rather than alphabetically, and Source sorts by the label you see rather than the value stored underneath. - Keyword Search — searches across the text fields at once.
- Column preferences — the column picker and its saved layouts behave as they do on every other Pro list.
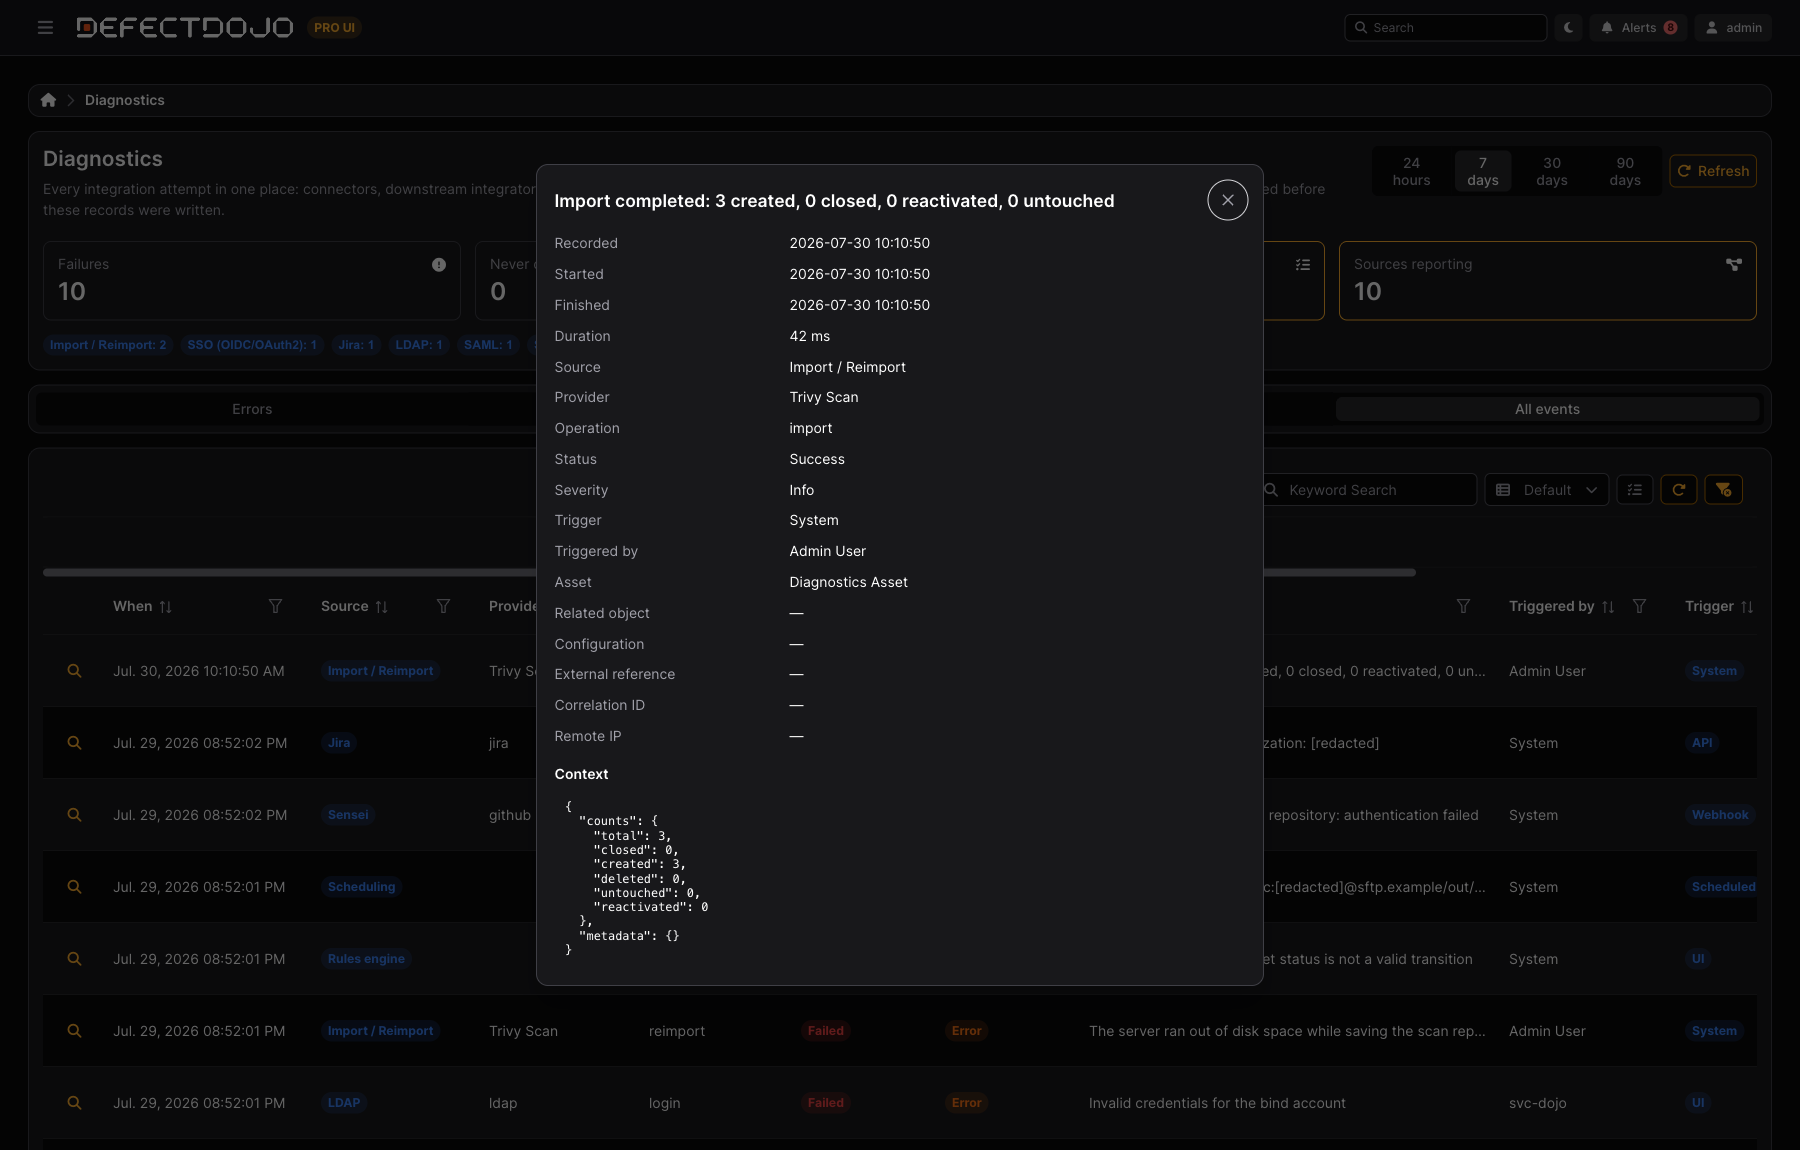
Click the magnifier at the start of a row to open the whole attempt:
Credentials are removed before the row is written
Integration errors quote the request that failed, and those quotes carry secrets: an Authorization header, a token in a query string, a password inside a connection URL. Diagnostics strips them on the way in, so the original value never reaches the database and no later change of mind can expose it.
Two things are scrubbed:
- Values under credential-shaped keys — anything whose key looks like a secret (
password,token,secret,api_key,authorization,private_key, and similar, in any capitalisation or with dashes or spaces). A small set of keys is exempt because only their presence matters, never their content. - Values that look like credentials wherever they appear — bearer and basic authorization headers, JWTs, credentials embedded in URLs (
https://user:pass@host), recognisable vendor token prefixes, and PEM blocks.
Each is replaced with [redacted]. The surrounding message is kept, so the error stays readable:
401 Unauthorized: Authorization: [redacted]
upload rejected: https://svc:[redacted]@sftp.example/out/…
Long values are truncated, and deeply nested context is flattened, so one enormous payload cannot bloat the table.
When anything was removed from a row, the row says so, rather than leaving you to wonder whether the field was empty or emptied.
Redaction is best-effort by design. The scrubber recognises credential shapes. A secret that looks like ordinary prose, under a key that does not read as sensitive, can still be recorded. Treat Diagnostics as an operational log, not as a place secrets are guaranteed to be absent — and keep the technical detail restricted to the people who need it.
Who sees what
Diagnostics is tiered, because the summary of a failure is useful to a product owner while the raw request behind it is not.
| Superuser | Everyone else | |
|---|---|---|
| Rows for Assets they are authorized on | Yes | Yes |
| Instance-level rows (no Asset) | Yes | No |
| Summary, source, status, severity, timings, configuration | Yes | Yes |
| Reported detail, Context, Remote IP | Yes | Withheld, and labelled as withheld |
A non-superuser sees that a detail exists and is being withheld, rather than an empty field that reads like missing data. Instance-level rows — SSO, SAML, LDAP, and other activity that belongs to no Asset — are superuser-only, since there is no Asset membership that could grant access to them.
How long records are kept
A scheduled task trims the ledger so it cannot grow without limit:
| Severity | Kept for |
|---|---|
Info | 30 days |
Warning, Error, Critical | 180 days |
Both windows are configurable with the DIAGNOSTIC_EVENT_INFO_RETENTION_DAYS and DIAGNOSTIC_EVENT_RETENTION_DAYS settings. Deletion runs in batches, so a large purge does not hold a long transaction open.
API
The ledger is read-only over the API, at /api/v2/diagnostic_events/:
| Endpoint | Returns |
|---|---|
GET /api/v2/diagnostic_events/ | The list, with the filters below |
GET /api/v2/diagnostic_events/{id}/ | One event |
GET /api/v2/diagnostic_events/summary/ | The counts behind the header cards, including the per-source tallies |
GET /api/v2/diagnostic_events/choices/ | The valid values for source, status, severity, and trigger |
Useful parameters:
| Parameter | Effect |
|---|---|
source, status, severity, trigger | Accept several comma-separated values at once |
failures_only=true | Failures and timeouts |
unresolved_only=true | Attempts still queued or running |
product_name | Filter by Asset name |
object_model | Filter by the kind of record the attempt was about |
o= | Ordering, prefixed with - to reverse (o=-created_at) |
The same access rules apply: a non-superuser gets Asset-scoped rows with the restricted fields withheld.
Working out what went wrong
- A ticket never appeared. Filter Source to the integrator (or Jira), then read Status.
Failedgives you the reason in Summary;Queuedwell after the fact means the job never ran, which is a worker or scheduling problem rather than a credential one. - A user cannot sign in. Filter Source to SSO, SAML, or LDAP, and read the failure for their attempt — a bad assertion signature, a rejected bind, a mismatched attribute. These rows are instance-level, so they are superuser-only.
- A scan did not show up. Filter Source to Import / Reimport. Look at Trigger to tell an unattended scheduled upload from someone’s manual one, and at Triggered by for who to ask.
- Something is retrying forever. Sort by Correlation ID, or filter to one, to see every attempt of the same logical operation together.
- “Nothing is working.” Open Successes for the same window first. A healthy list there turns a vague outage into a specific one.
Related
- Feature Flags — turning optional Pro features on and off
- Connectors — pulling findings in
- Pro Integrations — pushing findings out
- Single Sign-On — the identity providers whose sign-in attempts appear here